

For further information or news, please refer to MKMA Newsletters which are circulated to members only and published on tri-monthly basis.
根据 Fortune Business Insights 的报告,2022 年价值 944 亿美元的全球棉纱市场预计将从 2023 年的 828.1 亿美元扩大到 2028 年的 1006.8 亿美元左右,预计 CAGR 为 4% % 在估计期间。 估值上涨的原因被认为是影响成品纺织品质量的纱线的独特特性。
在纱线类型中,估计普梳纱部分在此期间显示出相当大的扩张,这是由于该产品用于制造羊毛线的增加使用。在估计期内,服装部门也将实现合理增长,这可归因于电子商务渗透率的提高、可支配收入的增加等。
为国内纺织行业的利益而增加的政府举措被视为推动棉纱市场增长的关键因素。 这些举措侧重于纺织行业的技能发展、基础设施建设和部门发展。然而,由于与合成纱线价格较低相比的价格竞争,行业扩张可能会受到阻碍。
亚太地区的棉纱市场份额预计在预测期内将大幅增长,这可以归因于人口增长和消费者支出增加对产品的需求不断增加。然而,据估计,欧洲市场在预测期内将实现有利可图的增长速度。 这是由多年来不断增长的原材料需求和产业用纺织品的兴起所推动。
全球阻燃服装市场 2023-2027 预计在未来五年内将增长 100104 万美元,在预测期内以 4.9% 的复合年增长率加速增长。
阻燃 (FR) 服装是技术纺织品领域的一部分,该领域是全球的阳光产业。
市场研究解决方案 Reportlinker 的“2023-2027 年全球阻燃 tecApparel 市场”报告提供了全面分析、市场规模和预测、趋势、增长驱动因素和挑战,以及涵盖约 25 家供应商的分析。
本研究确定可穿戴技术是未来几年推动阻燃服装市场增长的主要原因之一。 此外,通过零售和在线渠道不断增长的分销以及新兴经济体不断增长的需求将导致市场需求巨大。
一些领先的阻燃服装公司是 3M Co.、Ansell Ltd.、Arco Ltd.、Carhartt Inc.、Carrington Textiles Ltd.、Cintas Corp.、DEVA FM。 sro、DuPont de Nemours Inc.、Frham Safety Products Inc.、Honeywell International Inc.、Hultafors Group AB、Hydrowear BV、Kimberly Clark Corp. 等。
根据 IMARC Group 的一份报告,2022 年印度的纺织品回收市场规模达到 3.087 亿美元,预计到 2028 年将达到 3.75 亿美元,2023-2023 年期间的增长率(CAGR)为 3.4% 2028.
纺织品回收是对旧衣服、纤维废料、边角料等进行再加工和再利用的方法。这些材料通常来自地毯、轮胎、家具、鞋类、废弃衣服、毛巾和床单。
纺织品回收有许多环境和经济效益,包括降低水和土地污染水平、限制化学染料的使用、优化能源消耗、最大限度地减少对原生纤维的依赖等等。
模拟印度纺织品回收市场的关键因素包括对生态完整性服装的需求不断增加、可持续时尚的新兴趋势以及消费者对生产新服装对环境的不利影响的认识不断提高。
由回收纺织品、塑料和有机原材料制成的生态服装越来越受欢迎,这进一步促进了这一增长,这有助于限制浪费并最大限度地减少垃圾填埋场空间。
政府政策和非政府组织计划以及纺织废料数量的增加和回收技术的改进也在推动回收市场,除了各种技术进步和回收过程中日益自动化以及领先制造商的广泛研发之外。
2021 年全球智能和互动纺织品市场估计为 21.476 亿美元,预计到 2030 年估值将达到约 164 亿美元,从 2022 年到 2030 年的复合年增长率为 25.6%。智能和交互式纺织品是与边缘计算、云数据、人工智能 (AI) 和蓝牙低功耗 (BLE) 等技术集成的织物,可以监控和交流穿戴者的数据。
根据 Global Market Insights Inc. 发布的报告,在研发方面的投资激增,以制造能够在战争情况下提供伪装效果、智能感知和响应能力的装备精良的士兵制服,再加上面料中的智能技术,以实现更轻的负载和更少的设备,促进了智能和交互式纺织品在军事和国防应用中的使用。
军事用途的智能纺织品能够监测穿戴者的表现,并配备 GPS 系统、传感器和活动跟踪器,提供多种属性,即绝缘性能、防弹保护和防水面料。在这些因素的加速下,预计从 2022 年到 2030 年,军事和国防应用领域将以超过 28.5% 的复合年增长率大幅增长。
在区域格局中,预计到 2030 年,欧洲的智能和互动市场将出现大规模扩张,占据约 28% 的行业份额。
For further information or news, please refer to MKMA Newsletters which are circulated to members only and published on tri-monthly basis.
JELLYFISH SWIMWEAR(Code: MT0123-01)
30 PANMURE ST
ROUSE HILL
2155 NSW
AUSTRALIA
PRODUCT: BATIK APPAREL
EMPERIL-COMERCIO INTERNACIONAL S.A. (Code: MT0123-02)
RUA NOSSA SENHORA ASSUNCAO 1
ESPRELA – TROFA
4785-177
PORTUGAL
PRODUCT: POLYESTER FABRICS
MAXI IMPORT AS (Code: MT0123-03)
BJORNERUDVEIEN 15
1266 OSLO
NORWAY
PRODUCT: UNISEX APPAREL
本会不负任何交易后果。
欲索取联络 ,请联络本会办事处,并注明代号。
Fact.MR 发布的关于纺织染料市场的最新见解预测,到 2031 年,该市场的估值将超过 80 亿美元。快速发展的时尚趋势正在刺激对时尚服装的需求,促使制造商采用新的色彩组合和设计,推动销售,预计 到 2031 年以超过 6% 的复合年增长率推动市场扩张该市场在过去 5 年取得了令人瞩目的收益,到 2022 年底接近 60 亿美元。在此期间,年增长率约为 5%。 制造商预计将主要关注亚洲市场,印度和中国等主要国家将成为利润丰厚的增长中心。根据印度品牌资产基金会 (IBEF) 的数据,印度纺织业在 2018-19 财年占工业产值的 7%,预计到 2027 年估值将超过 230 亿美元。同样,根据纺织世界的数据,中国的化纤生产 超过 5000 万吨,占全球产量的 66% 以上。 这种趋势正在激励知名企业加大对这些市场的涉足力度。
市场研究的要点
• 对直接纺织染料的需求保持高位,到 2031 年将超过 20 亿美元
• 到 2031 年,活性纺织染料将以约 7% 的复合年增长率实现最快增长
• 预计粘胶纤维染料的复合年增长率约为 6%
• 涤纶纺织染料增长迅猛,复合年增长率约为 7%
• 美国纺织染料销售额可能会增加,2021 年达到近 7 亿美元
• 到 2031 年,印度、韩国和澳大利亚的总收入将略高于 6 亿美元
• 中国纺织染料领域的收入将超过 20 亿美元
For further information or news, please refer to MKMA Newsletters which are circulated to members only and published on tri-monthly basis.
For further information or news, please refer to MKMA Newsletters which are circulated to members only and published on tri-monthly basis.
MAXI IMPORT AS (Code: MT0322-01)
BJORNERUDVEIEN 15
1266 OSLO
NORWAY
PRODUCT: UNISEX APPAREL
TARGET CONTRACT SRL (Code: MT0322-02)
VIA MONTE ROSA 27
LIMBIATE (MI)
20812
ITALY
PRODUCT: WOVEN FABRIC
SIAM BUSINESS & TRADING CO., LTD. (Code: MT0322-03)
1011-5 SONGWAT RD.KHWANG SAMPHANTHAWONG,
KHET SAMPHANTHAWONG, BANGKOK
10100 THAILAND
PRODUCT: LADIES APPARELS
CHEMISETTE (Code: MT0322-04)
16 DE SEPTIEMBRE NO.621
MONTERREY NUEVO LEON
MEXICO
PRODUCT: LADIES APPARELS, LADIES UNDERGARMENTS
根据 Future Market Insights 的最新研究,尽管 2020 年增长放缓,但在 2021-2031 年的预测期内,全球二手服装市场销售额预计将以 11.2% 的复合年增长率增长。
2021 年,衬衫和 T 恤占据了 29% 的市场份额,原因是随着职业女性劳动力不断扩大,消费者偏好产生了变化。
该报告进一步指出,由于存在大量较低的社会经济消费者基础,巴基斯坦占南亚二手服装销售额的 40% 以上,而危地马拉在拉丁美洲领先,在预产期内占据超过 30% 的价值份额。
这一增长归因于终端消费者生活方式的变化,加上工业化、城市化、经济发展和全球化,在过去十年加速了时装业的销售,特别是在发展中的国家和地区。电子商务也改变了购物体验,超过 60% 的人选择通过在线平台购买产品、服务和获取商品。该报告进一步提到,ThredUP 和 Poshmark 等公司的存在将在未来几年推动对廉价和生态替代新衣服的需求。 在线分销渠道的扩张也将是兆头。消费者对在线转售平台的认知度不断提高,快速增长的在线初创企业提供二手品牌、设计师商品和租赁民族服饰,这进一步推动了二手服装市场的发展。
中国产业用纺织品行业在两年内增长了 12%。根据国家统计局的数据,2021 年 1 月至 2021 年 9 月,非织造布和帘子布产量分别下降 1.01% 和上升 29%。过去两年,产业用纺织品行业的营业收入下降了 14.74%,相比之下,前两年的平均涨幅为 10.78%。在前两年平均增长 14.12% 之后,他们的整体收入同比下降了 63.78%。营业利润率为5.25%,比上年下降7.11个百分点。 31家上市企业第三季度营业收入下降1.15%,整体利润下降33.59%。例如,运输车辆用纺织品和过滤纺织品领域的上市企业增长强劲。
前三季度,非织造布、特种纱、麻绳(索)、丝带出口增长6.91%。非织造布出口下降了 4.52%。出口量增长8.06%。工业用纺织品出口额增长39.74%。化纤无纺布防护服(含医用防护服)出口下降79.81%。
For further information or news, please refer to MKMA Newsletters which are circulated to members only and published on tri-monthly basis.
PT.SHAILENDRA TSHAI INDONESIA (Code: MT0222-01)
UDANG 3 MULTI KAVLING A 03/03/KEL, KADU
KEC.CURUG, TANGERANG, BANTEN 15810
15810 TANGERANG INDONESIA
INDONESIA, REPUBLIC OF
PRODUCT: BABIES APPAREL
COMERCIAL COPELEC SA (Code: MT0222-02)
AV 18 DE SEPTIEMBRE 688
CHILLAN CHILLAN
CHILE
PRODUCT: LADIES APPARELS
LUCKY STAR WEAVING CO., LTD. (Code: MT0222-03)
33/8, 33/11 MU4, OMYAI, SAMPRAN, NAKORNPATHOM
73160 THAILAND
PRODUCT: YARNS
2020 年全球产业用纺织品市场规模为 1903.3 亿美元,预计到 2028 年将达到 2858.8 亿美元,从 2021 年到 2028 年的复合年增长率为 5.15%。
Verified Market Research 的一份报告称,由于全球人口以惊人的速度增长,预计纺织品的增长将在预测期内激增,从而导致采用现代技术来促进成果。
该报告按材料(天然纤维、合成聚合物、金属、矿物、再生纤维)、工艺(机织、针织、无纺布)、应用(运输纺织品、医疗和卫生纺织品、工业产品和组件)分析了产业用纺织品市场) 和地理。
由于跨境需求高,技术纺织品的出口活动增加,有利于市场增长。
然而,与传统的低成本替代品相比,该市场的增长主要是由于产品成本高而受到阻碍。这主要是由于用于制造这些技术纺织品或在制造过程中使用的原材料成本上涨。
在全球范围内,公司正在扩大产业用纺织品领域;例如,去年,土工建筑材料制造商NAUE推出了可生物降解的无纺土工布Secutex Green。
Freudenberg Performance Materials Apparel 推出了适用于 Freudenberg Active Range 中所有类型运动服的新型高弹性和透气衬垫和胶带。
同样,全球科技集团 Freudenberg 收购了总部位于英国的 Low & Bonar PLC,这是一家生产技术纺织品的公司,收购金额未披露。
印度政府也准备通过 PLI 计划吸引对这一产品类别的投资。
根据最新报告,到 2027 年底,全球自适应服装市场价值预计将达到 4087.6 亿,复合年增长率为 4.1%。
适应性服装是专门为有不同程度残疾的人设计的服装,包括后天残疾、先天缺陷、先天性发育障碍和其他身体残疾。专门为满足这些群体的需求而设计的服装可以为在英国生活的许多人提供一种赋权感并提高生活质量。不幸的是,对于有学习障碍的人来说,适应性服装通常是有这种类型障碍的人最不希望购买或穿着的。但是,有一些选项可以为这些人在款式、合身性和功能方面提供更多选择,使他们能够购买外观精美且功能良好的物品。紧身裤、紧身衣、袜子和裤子都是适应性服装,适合那些可能难以每天走路、说话或执行普通任务的人。紧身裤和紧身裤是最容易穿脱的可穿戴服装类型之一,这要归功于它们紧贴身体的方式,并且可以根据个人穿着者的体型和尺寸进行塑造。适应性服装(例如这些特殊类型的服装)采用高质量、耐用的材料制成,可抗撕裂、撕裂和褪色。
For further information or news, please refer to MKMA Newsletters which are circulated to members only and published on bi-monthly basis.
For further information or news, please refer to MKMA Newsletters which are circulated to members only and published on bi-monthly basis.
For further information or news, please refer to MKMA Newsletters which are circulated to members only and published on bi-monthly basis.
For further information or news, please refer to MKMA Newsletters which are circulated to members only and published on bi-monthly basis.
For further information or news, please refer to MKMA Newsletters which are circulated to members only and published on bi-monthly basis.
For further information or news, please refer to MKMA Newsletters which are circulated to members only and published on bi-monthly basis.
For further information or news, please refer to MKMA Newsletters which are circulated to members only and published on bi-monthly basis.
For further information or news, please refer to MKMA Newsletters which are circulated to members only and published on bi-monthly basis.
For further information or news, please refer to MKMA Newsletters which are circulated to members only and published on bi-monthly basis.
For further information or news, please refer to MKMA Newsletters which are circulated to members only and published on bi-monthly basis.
For further information or news, please refer to MKMA Newsletters which are circulated to members only and published on bi-monthly basis.
For further information or news, please refer to MKMA Newsletters which are circulated to members only and published on bi-monthly basis.
For further information or news, please refer to MKMA Newsletters which are circulated to members only and published on bi-monthly basis.
For further information or news, please refer to MKMA Newsletters which are circulated to members only and published on bi-monthly basis.
For further information or news, please refer to MKMA Newsletters which are circulated to members only and published on bi-monthly basis.
For further information or news, please refer to MKMA Newsletters which are circulated to members only and published on bi-monthly basis.
For further information or news, please refer to MKMA Newsletters which are circulated to members only and published on bi-monthly basis.
For further information or news, please refer to MKMA Newsletters which are circulated to members only and published on bi-monthly basis.
For further information or news, please refer to MKMA Newsletters which are circulated to members only and published on bi-monthly basis.
For further information or news, please refer to MKMA Newsletters which are circulated to members only and published on bi-monthly basis.
For further information or news, please refer to MKMA Newsletters which are circulated to members only and published on bi-monthly basis.
For further information or news, please refer to MKMA Newsletters which are circulated to members only and published on bi-monthly basis.
For further information or news, please refer to MKMA Newsletters which are circulated to members only and published on bi-monthly basis.
For further information or news, please refer to MKMA Newsletters which are circulated to members only and published on bi-monthly basis.
For further information or news, please refer to MKMA Newsletters which are circulated to members only and published on bi-monthly basis.
For further information or news, please refer to MKMA Newsletters which are circulated to members only and published on bi-monthly basis.
For further information or news, please refer to MKMA Newsletters which are circulated to members only and published on bi-monthly basis.
For further information or news, please refer to MKMA Newsletters which are circulated to members only and published on bi-monthly basis.
• The per capita consumption of textiles for the year 2007 is 22.41 metres as against 21.49 metres in 2006 recording a growth of 4.28 %. On an average, a person purchased and used 0.92 metres more of textiles and clothing in the year 2007 than the previous year.
• On an average, an Indian spent Rs. 1488.39 on the purchase of textiles & clothing in the calendar year 2007, which is more by Rs. 97.30 over the previous year (a growth of 6.99 percent).
• The market size for textiles and clothing in India has stood at 25493 million metres in the year as compared to the previous year’s estimate of 24030 million metres (a growth of 6.09 percent).
• In value terms, the size of the Indian textile market was Rs. 1692952 million in 2007. The same for the year 2006 was Rs. 1555835 million, a growth of 8.81%).
• 3.22 percent of the Indian households have not purchased any textile items during this year while 14.64 percent of the households purchased textiles & clothing up to Rs. 1000.
• The highlights also include the gradual and most perceptible change in the fibre preference of the Indian consumers. Among all the fibre combinations, in 2007 too, the man-made and blended/mixed textiles taken together continue to grow, which has recorded a share of 60.08 percent in the total consumption in quantity. While Pure Cotton textiles & clothing has a share of 38.95 percent in the consumption, Pure Silk and Woollen products have a meager share of 0.62 percent and 0.35 percent respectively.
• Market for Shirt:
The total market size of readymade shirts has stood at 419 million pieces in 2007 as compared to 399 million pieces in 2006. The demand for shirt has thus gone up by 5.01 percent in 2007 over the demand in 2006.
The man-made and blended/mixed shirts are more popular with a demand share of 71.12 percent as against 28.88 percent of pure cotton shirts. The demand for cotton shirts during this period are estimated at 121 million pieces and man-made and blended/mixed shirts are estimated at 298 million pieces.
• Market for Trousers:
The total market size of readymade trousers is 314 million pieces in 2007 as compared to 292 million pieces in 2006. The demand for trousers has thus gone up by 7.53 percent. The trousers market shows a consistent and gradual increase in size.
The man-made and blended/mixed trousers more popular with a demand share of 73.25 percent of the market as against 26.75 percent of cotton trousers. The demand for cotton trousers during this period is estimated at 84 million pieces and for man-made and blended/mixed trousers it is estimated at 230 million pieces.
• Market for Jeans (Male):
The total market size of readymade Jeans (Male) has been estimated at 173 million pieces in 2007 as compared to 163 million pieces in 2006. Out of the above, the urban areas have a share of 43.35 percent and rural areas a share of 56.65 percent.
• Market for Jeans (Female):
The total market size of Jeans (F) has stood at 9 million pieces in 2007 as compared to 8 million pieces in 2006. The urban consumers mainly dominate in the usage pattern and this is close to 100 percent.
• Market for T-shirt (Male):
The total market size of readymade T-shirt (M) has stood at 179 million pieces in 2007 as compared to 165 million pieces in 2006 showing an increased demand for T-shirt (M) by 8.48 percent.
• Market for T-shirt (Female):
The total market size of readymade T-shirt (F) has stood at 13 million pieces in 2007 as compared to 11 million pieces in 2006 showing a growth of 18.18 percent.
• Market for Bedsheet:
The total market size of Bed Sheet has stood at 156 million pieces in 2007 as compared to 148 million pieces in 2006. The demand for Bed sheet has thus gone up by 5.41 percent in 2007 over the demand in 2006.
The cotton bedsheet is the popular with a demand share of 93.59 percent of the market as against 6.41 percent of man-made and blended/mixed bedsheet. The demand for cotton bedsheet during the period is estimated at 146 million pieces and for man-made and blended/mixed bedsheet it is estimated at 10 million pieces.
• Market for Towel/Terry Towel:
The market size of towel has stood at 400 million pieces in 2007 as compared to 387 million pieces in 2006. The demand for towel has thus gone up by 3.36 percent.
The total market size of terry towel has stood at 15 million pieces in 2007 as compared to 13 million pieces in 2006. The demand for terry towel has thus gone up by 15.38 percent.
Rules of Origin (ROO) are the criteria used to determine where a good has been made, for the purpose of ensuring that only the products of countries which are party to the FTA, enjoy tariff preferences (elimination/reduction of import duties).
Types of Rules of Origin (ROO)
Malaysia – Japan JMEPA
The Japan-Malaysia Economic Partnership Agreement (JMEPA) entered into force on 13 July 2006. For textile and apparel products, tariffs are eliminated with immediate effect.Rules of Origin for Textile and Apparel Products are as follows :
ASEAN-China FTA (ACFTA)
ASEAN-China FTA for Trade in Goods Agreement (TIG) was signed on 29th November 2004. Tariff on textiles and apparel will be fully eliminated by 1st January 2010 or 2012.
Product Special Rule (PSR) for textiles and textile products adopted from CEPT ROO. Exporters can choose the Alternative Rule of either
ASEAN-Korea FTA (AKFTA)
Negotiations for the AKFTA commenced in 2005. The Trade in Goods (TIG) chapter of the AKFTA entered into force on 1 June 2007, while negotiations for the Trade in Services chapter are still ongoing. Tariffs for most textile and apparel items are scheduled to be eliminated by 2009.
Product Special Rule (PSR) was adopted for textile products :
Malaysia – Pakistan FTA (MPFTA)
Malaysia – Pakistan Free Trade Agreement was launched on February 2005. Both countries signed an Agreement on Early Harvest Programme (EHP) on 1 October 2005 which came into force on 1 January 2006.
Tariffs on products identified for the EHP have been reduced to 0-5 per cent. Under the EHP, Malaysia offered a total 114 products covering yarn, clothing and textile products. Pakistan offered 125 products covering electrical appliances and machinery, plastics, chemicals, rubber and timber products.
Negotiations are on-going and expected to be completed by end-2007. One process Product Special Rule (PSR) applied to textiles and textile products. The process covers spinning, weaving, bleaching, dyeing, printing and finishing.
Below are the documents needed to enjoy preferential duty treatment under the abovementioned bilateral or multilateral agreements :
Malaysia and the US jointly announced the launch of negotiations for free trade agreement (FTA), on March 8 with formal negotiations on the FTA commencing in three months after the expiry of a 90-day consultation period with the US Congress and expected to be completed by early 2007.
US-Malaysia bilateral trade totaled US$44 billion (RM164 billion) in 2005 from which Malaysia had a trade surplus of US$34 billion (RM127 billion) and accounted for 16.8 percent of Malaysia’s global trade.
The US is Malaysia’s largest export destination, with total exports valued at RM105 billion (US$27.7 billion) or 19.7 percent of Malaysia’s global exports in 2005.
In terms of imports, the US is Malaysia’s second largest source of imports in 2005, with total imports valued at RM55.9 billion (US$14.8 billion).
As for investments, US remain an important source of foreign direct investment in the manufacturing sector in Malaysia. In 2005, the US was the largest source of foreign direct investments with total investments amounting to RM5.155 billion (US$1.4 billion), and representing 29 percent of total approved foreign direct investments in the manufacturing sector.
US-Asean Business Council Endorses US-Malaysia FTA Talks
Meanwhile the US-Asean Business Council also endorsed the FTA. The Council has been the leading private sector advocate behind the start of FTA talks with Malaysia. In December of last year, a Council delegation of 18 executives to Malaysia to encourage the start of FTA talks.
The US-Asean Business Council is the Secretariat of the US-Malaysia FTA Business Coalition.
The Coalition is co-chaired by representatives of several of the most recognised US brands, including American International Group, Cargill, Citigroup, Discovery Communications, Inc, Federal Express, General Electric Company, Intel Corporation and Oracle Corporation. Its Steering Committee is composed of the most influential American trade associations active in Washington.
With talks now announced, the full weight of this coalition will be brought to bear on achieving an agreement that can pass Congressional muster, and on building the necessary Congressional support.
Malaysia will join a list of 11 other countries with which Washington is currently negotiating free trade deals. FTAs already reached with Oman, Peru and Colombia is expected to receive Congressional consideration in the months ahead. Already under way are FTA negotiations with Panama, Ecuador, the United Arab Emirates, the five countries of the South African Customs Union, South Korea and Thailand.
Introduction
GST (goods & Service tax) is also known as Value Added Tax (VAT). The Malaysian government has decided to implement the GST in replacement of the current Sales & Service Tax system starting from 1st January 2007. However, many people still do not know what is GST. Some even never heard of the term GST.
MKMA has held 2 seminars in Batu Pahat and Kuala Lumpur respectively to educate our members and the public on the basic concept of GST with overwhelming response of 110 participants from 46 companies in total.
What is GST?
THE GST is a tax on domestic consumption. The tax is paid when money is spent on goods and services, including imports.
The GST charged to customers is called output tax and that paid on purchases by businesses is called input tax.
What happens to the current sales tax and service tax?
The current sales tax and service tax will be abolished by 2007. All persons who are at present licensed under the Sales Tax Act 1972 and Service Tax Act 1975 will need to register for the GST. The registration process is scheduled to start in July 2006.
How will it affect a supplier, manufacturer, wholesaler and retailer?
The supplier, manufacturer, wholesaler or retailer would have to pay for GST on his business purchases which are standard rated before selling his product. This means that he may have to carefully plan his cash flow and turn around time to cope with his business activity. Improper planning may lead to a huge cash flow deficit as it may take a few months before his product can be sold to the consumer.
GST is imposed on every stage of input, until the final goods is sold to the customer.
Registration for GST
Any person who is required to be registered needs to do so with the Royal Malaysian Customs Department. Registration can be done online or manually. A person who is not required to be registered can opt for voluntary registration and claim input tax credit on his purchases.
How is GST levied on imported goods and services?
For imported goods, GST will be levied together with the import duty and excise duty, if any, by declaring on the Import Declaration Form, and is payable at the time the goods are cleared from Customs control. The value of the imports should be in Ringgit.
In addition, a number of imported goods that are listed under the Import Relief Order are to be exempted from GST.
What about exported goods and services?
All goods exported out of Malaysia will be zero-rated. This means that the registered exporter does not collect GST on his exports but is able to claim credit for the GST that he has paid on his inputs. However, the exporter must retain supporting documents such as the Export Declaration Forms and copies of his invoices issued as evidence of export.
How to claim input tax credit?
The GST registered person, who is actually the supplier of goods or services, is eligible to claim input tax credits for any GST paid in the course of making the supply.
The net amount to be paid to the Customs is the difference between the input tax and the output tax. If the amount is positive, then that amount is payable to Customs. If it is negative, then a refund can be claimed. The reason for this is that GST, being a value added tax, is only payable on the portion of the value added to the goods or services.
How to prepare for GST?
Companies need to consider how to carry out the preparation for a smooth GST implementation and compliance. They may wish to seek professional assistance to review his current system to identify his business set–up and supply chain and to change or modify the system to be GST compliant by end 2006 without disruption to the day-to-day business activities.
The right accounting software package complete with GST capabilities is essential. It is important for the accounting software to be able to integrate all the relevant data from the modules of sales, procurement, inventory, receivables, payables and to generate accurate and complete reports and forms required by the Customs. Having an e-filing feature will be ideal.
To ensure efficient and effective implementation, a committee needs to be set up and headed by a senior person, ensuring all departments of the company understand what is required of them in order to comply with the GST.
Training is vital on the usage of the accounting software and GST implementations.
Conclusion
The GST legislation is expected to be passed sometime in March or April 2006. It is hoped that the Malaysian Government will start off with a low GST rate.
With a broader base for goods and services being subject to GST, the revenue for the Government is expected to be higher. The GST, being a consumption tax, is likely to have a temporary inflationary effect on taxpayers.
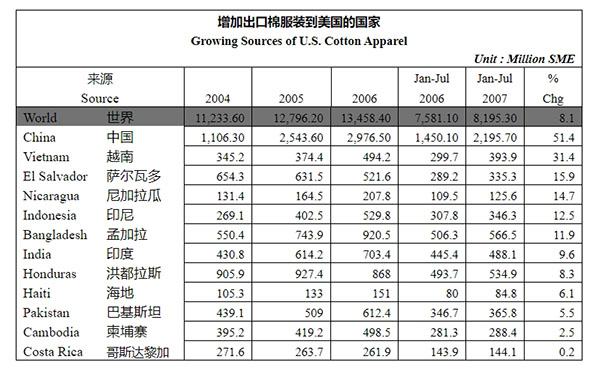
China’s role has definitely gained momentum, with imports surging 51.4 percent to 2.195 billion square meters. The second fastest-growing supplier is Vietnam increasing 31.4 percent to 393.9 millions square meters.
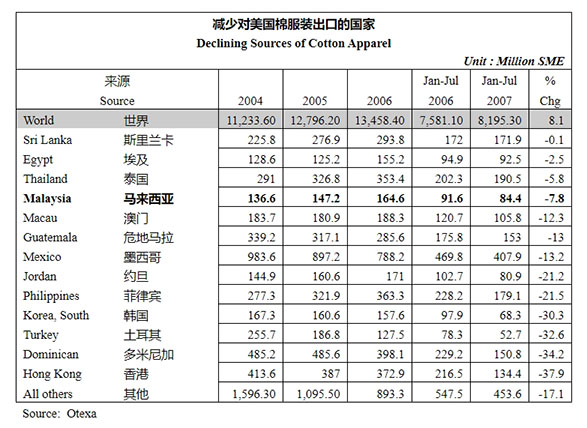
Within CAFTA, EL Salvador, Honduras and Nicaragua have emerged the winners as suppliers to the U.S. Indonesia, Bangladeshi and India are expanding their imports to the U.S., but Pakistan is losing market share. Imports from many of the traditional suppliers, such as Hong Kong, Turkey, South Korea, Malaysia, Philippines, Jordan and Mexico, have sharply declined.
China’s textile exports to most of these markets went up, with that to France and Spain jumping over 80% year on year.
From January to October, China’s provinces of Jiangsu, Zhejiang and Guangdong as well as Shanghai saw their textile exports exceed 10 billion US dollars.
The textile export volume of these four regions accounts for about 70% of China’s total textile exports.
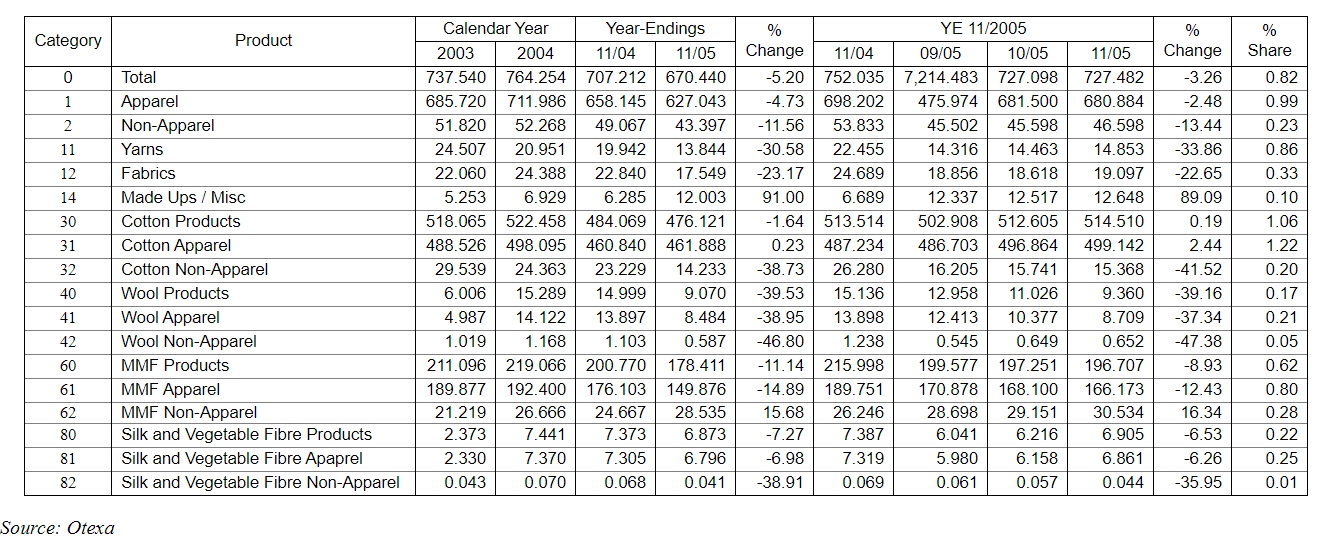
Much of the attention in the post 2005 quota period has been on the success of India, Pakistan and China in rapidly expanding exports of textiles and apparel. Without anywhere near the same attention, Thailand’s exporters have proved successful in expanding exports throughout 2005. The expansion has occurred despite little domestic production of cotton; nonetheless, cotton apparel exports have enjoyed the most rapid growth.
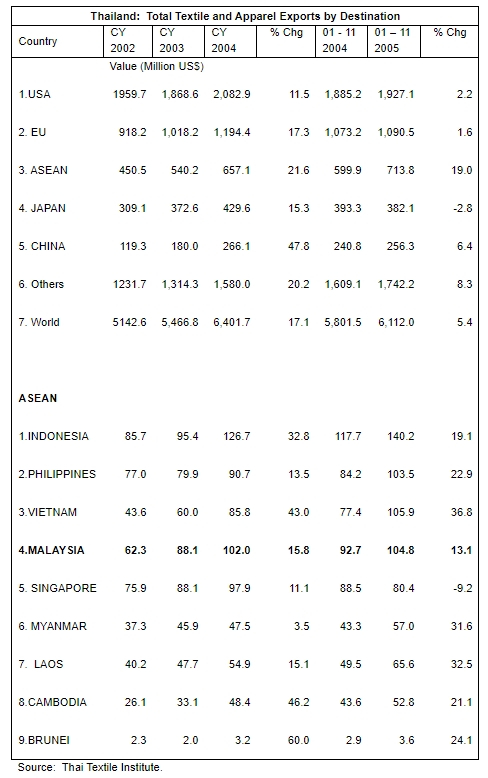
Thailand’s top export market is the United States; exporters have been successful in obtaining orders from all the major U.S. apparel brands. During the January through November time period, 31.5% of all exports have moved to the U.S., reaching 1.927 billion U.S. dollars and year-on-year growth of 2.2%. Despite this success, the Thai exporters and government are pushing hard for additional growth to the U.S. market. The Thai Garment Manufacturers Association and the Ministry of Commerce are jointly opening a U.S. office to promote one stop sourcing for U.S. apparel brands and retailing. The U.S. office will simplify orders, transportation, etc. Thailand’s exporters have also abandoned many of the cheaper, lower end products and moved into the high end products, which changes its competitors.
The European Union is Thailand’s second largest export destination. Export growth through November 2005 was limited to 1.6%, with shipments of 1,090 billion U.S. dollars. One reason for this is that EU import demand has been much weaker than in the United States.
One of the most important components to Thailand’s export expansion was the ability of exporters to benefit form the boom in domestic consumption of textiles and apparel through Asia itself. In 2005, the Asean trade block of nations was the third largest export market for Thailand’s textile and apparel. It also enjoyed the fastest growth. January through November exports to this trade block soared 19.0% to 713.8 million U.S. dollars and took 11.7% of all exports. Strong growth was enjoyed to most of the Asean trade block. The top markets were Indonesia, Philippines, Vietnam and Malaysia; double-digit export growth was noted to all four. Exports to Myanmar, Laos and Cambodia were smaller, but also enjoyed double-digit growth.
The Japanese market proved a disappointment in 2005. Despite Japan increasing the overall volume of textile and apparel imports, Thailand exports were unable to expand market share against China. January through November exports fell 2.8% to 382.1 million U.S. dollars. China emerged as a very important market itself. Through November 2005, China emerged as the fifth largest market, with exports expanding 6.4% to 256.3 million U.S. dollars.
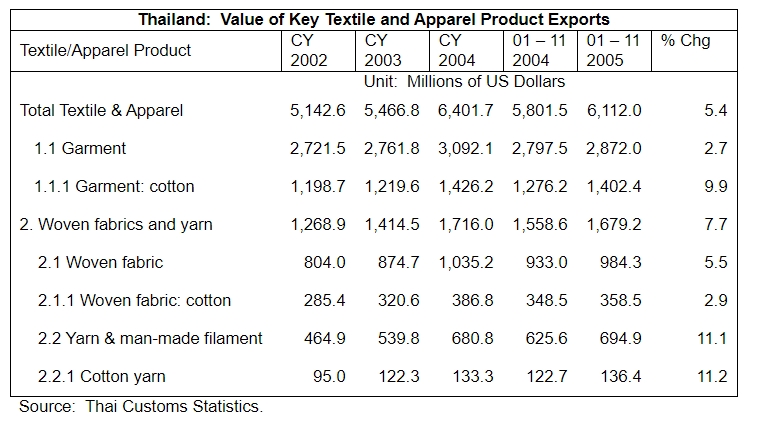
Cumulative January through November textile and apparel exports reached 6.112 billion U.S. dollars, reflecting year-on-year growth of 5.4%; apparel accounted for 3.163 billion of the total. Within the apparel sector, the strongest growth in exports came in co tton apparel. Cotton apparel exports expanded 9.9% from year-ago levels to 1.402 billion U.S. dollars, which compares to a 2.3% year-on-year decline in man-made fiber apparel exports to only 678.2 million U.S. dollars.
Strong growth has been noted in textile exports, woven fabric and yarn exports expanded 7.7% to 1.679 billion U.S. dollars. Woven fabric accounted for 984.3 million of that total, with cotton fabric exports totaling only 358.5 million U.S. dollars. Strong growth was noted in man-made fiber yarns, which expanded 11.1%. Household textile exports expanded to 219.2 million U.S. dollars.
US clothing demand grew vigorously in early 2005, helping to boost sales by major retailers such as Target and Wal-Mart. But the gains have gone mainly to foreign suppliers in Bangladesh, India and especially China.
In Latin America, Brazil exporters enjoyed growing demand in Argentina, China, Mexico, Paraguay, Uruguay and the Andean region. In Colombia clothing exports reached a record high while textile shipments soared. But Mexico faces tough competition in the US market from India, Bangladesh and other Asian suppliers.
EU15 output and orders fell in early 2005 as the stronger euro and quota elimination took their toll. The deficit rose for a fourth year as higher imports from Bangladesh, China and Pakistan offset modest export growth. But a new trade deal should stem the import surge from China. Meanwhile, firms are investing in China, India, Eastern Europe and North Africa. New EU states are investing in technical textiles.
In Japan, output continues to spiral downwards as foreign competition intensifies and firms invest in low cost facilities overseas. Exports from China, which supplies 80% of Japan’s clothing imports, soared by 21.1% in the first eight months of 2005. Yarn output rose by 23.8%, fabric by 16.7% and clothing by 19.4%. But success has led others to impose quotas on its exports.
Quotas have benefited Hong Kong as some operations have been moved back from China. But Hong Kong firms are investing in Cambodia, India, Indonesia and Jordan rather than China to avoid quotas.
In South Korea higher sales to China have only partly offset falling sales in the USA and many firms are turning to high-tech products. Firms in Taiwan have also suffered although some fibre makers are still investing. Indonesia has gained from quota elimination with exports up 32% in the first five months of 2005. But foreign direct investment has fallen.
Thailand and Malaysia have done better than expected with higher exports and output, despite relocation by some firms to Vietnam, Laos, Cambodia and Bangladesh. In Vietnam growth has been slowed by quotas on exports to the USA. Clothing exports from Bangladesh, helped by brisk sales in the USA, have done surprisingly well. But textile exports from India were sluggish, and much of the technology remains obsolete. Pakistan and Sri Lanka, by contrast, are enjoying brisk growth, despite Chinese competition.
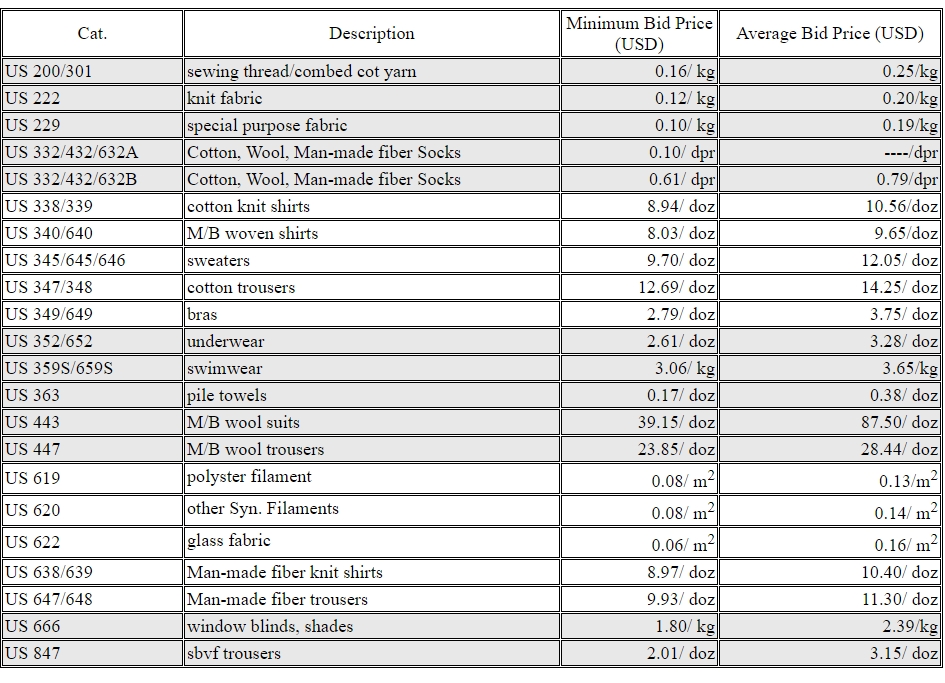
Qualified textile enterprises in China joined the bidding for export quotas on 21 categories of textiles to the United States for year 2006 on early December 2005. The competition was very heated. The bid result released on 10 December 2005 shown that quota was allocated to 3,734 textile enterpri ses. The final prices on most textile categories were much higher than the minimum bid prices. (To view full list of US quota bid result list, please browse MKMA homepage.)After seven rounds of talks, the United States and China in November signed a three-year agreement on textile trade, imposing quotas on Chinese textile products but clearing a major obstacle to bilateral trade.
A total of 21 types of clothing and textiles have been placed under the import restrictions. The agreement provides for a progressive increase in imports of major textiles and apparel products from China — by 10 to 15% in 2006, 12.5 to 16% in 2007, and 15 to 17% in 2008.
China has set aside 30% of US quotas for public bidding. The rest will be allocated to exporters based on their performance in the past year.
Yan Haiping, an export business manager, said the company believed bidding was important, although he knew US quotas would be mainly achieved from performance-based allocation.
Minimum bid levels range from 0.1 yuan (12 US cents) to 1 yuan per 1,000 kilograms and from 0.2 yuan per dozen to 12 yuan per dozen, depending on the product.
After companies get a quota, they can sign export contracts with importers in the United States.
Bid price to US Textile Quota Year 2006
As China reached agreements with both the European Union and the United States on quantitative limits on textile exports to the two markets, it would constitute double curbs on Chinese textile producers and exporters if the export tariffs were remained.
All export tariffs on textile products has been cancelled from Jan. 1, 2006.
China’s flexible tariff on cotton imports outside import quotas were created to maintain the stability of cotton prices in China, and the tariff rates would range from 5% to 40%.
The EU Generalized System of Preferences (GSP), implemented since 1971, grants unilateral tariff concessions to developing countries, that is, without any reciprocal concession from beneficiaries.
What does the new EU-GSP offer to Malaysia?
Ø consumer electronics (53.4% of total Malaysian exports to the EU in 2004),
Ø plastics and rubber (6.5%),
Ø wood (3.0%),
Ø clothing (1.8%)
Ø cereals and malt and starches (0.01%).
Accordingly, the share of Malaysia’s merchandise exports to the EU that is eligible for preferential tariff will rise from 16.2% in 2004 under the current EU-GSP to 80.9% under the new EU-GSP (assuming 2004 trade figures).
The two countries will lower their tariff upon Chinese textile goods to zero in 2010, and the Philippines will reduce its textile tariff in a similar way.
Indonesia, with its tariff rate against Chinese textile goods below 5%, will directly lower it to zero in 2009.
Vietnam’s previous textile tariff rate was as high as 36.6%, and it dropped to 31% after July 1, 2005, and will drop to 27.2% in 2006. It is expected to reach 26.6% in 2007, 22.8% in 2008, 19% in 2009, 12.6% in 2011, 5.8% in 2013 and zero in 2015.
Beginning from July 2005, China, Brunei, Malaysia, Indonesia, Myanmar, Singapore and Thailand gave tariff cuts to each other on 7,455 kinds of commodities. The practice was launched in compliance with the Trade in Goods Agreement of a Framework Agreement for Overall Economic Cooperation between China and the ASEAN countries.
By 2010, China and six old ASEAN member nations, including Brunei, Indonesia, Malaysia, the Philippines, Singapore and Thailand, will impose zero tariffs on most normal products, while China and the other four new ASEAN members of Cambodia, the Laos, Myanmar and Vietnam will do the same in 2015.
The China-ASEAN FTA has a population of 1.8 billion and two trillion U.S. dollars in gross domestic product (GDP). It will become the third largest global trading region after the European Union and the North American Free Trade Zone.
During the January-November period of 2005, China exported textile and apparel worth 5.08 billion U.S. dollars to the ASEAN, growing 22.4% year on year and accounting for 4.8% of China’s total textile export.
Meanwhile, China imported textile and apparel worth 620 million U.S. dollars from the ASEAN, growing 5.8% year on year and making up 4% of China’s total textile import.
Eight major Asian textile and apparel players share many weaknesses creating hurdles to the growth of their share in the international markets.
These countries, covering nearly 50% of global exports of apparel and 80% of Asian apparel exports, have many common problems, including low- price image, environmental and social regulations, high electricity and fuel cost, dearth of trained manpower, infrastructure impediments and little exposure to high-tech machinery, said a study conducted by a Sri Lankan textiles and clothing sector writer, A H H Saheed, who is also a chartered marketer by profession. These countries are Pakistan, Bangladesh, China, India, Indonesia, Sri Lanka, Thailand and Vietnam.
The study, named Global Apparel Industry and Major Asian Suppliers, has discussed weaknesses of each of the Asian countries dealing in apparel industry separately.
Pakistan: Major weaknesses of Pakistan’s apparel industry include low-price image, reliability, marketing, environmental and social regulation and inadequate infrastructure, including power, water and the road network not able to provide foundation for a dynamic industrial sector.
Similarly, very expensive power, low grade technology leading to low productivity and poor quality, outdated machinery, lack of considerable upgradation of human resource skills and confusion in political, religious and social situation, including terrorism.
India: Again low price image is a major weakness like Pakistan and other Asian countries. Besides, buyer hardship and control, environmental and social regulations, narrow export base in garment as over 50% is confined to four products, relatively low technology, hardly available traditional tailoring background and automation in decentralized garment sector, inconsistent, low quality and productivity and a higher power cost in India’s power cost also hampering growth there.
As per ITMF – Study 2003, power cost in India is $ 0.08 per kw, higher comparing with other seven countries and China, Brazil, Korea, Turkey and the USA. Then India’s cotton yield is only 372kgs per hectare as compared with the world average 900-1000kgs per hectare. Low labour productivity, pro-employees labour laws resulting in unproductive employees union in India, which are mainly externally and politically motivated.
China: The quota restriction and safeguard measures from the US and the EU are described as major weaknesses of the apparel industry in China. Then wage rates in the apparel industry and other production costs, land prices, training, social fees and shipping costs are rising, Social responsibility/accountability and labour issues, low price image, buyer hardship, mass production/flexibility have been counted as some other major issues in China.
Bangladesh: Low-price image again emerges as a major weakness in Bangladesh. According to the writer, interest rate for long-term in Bangladesh is very hi gh, that is, 9-12%, as compared with 5-6% of competitors. Similarly, no fund for assistance to textile and apparel sector has been created and when it is coupled with the dearth of trained manpower of international standards and lower labour, the situation is translated into low productivity and inconsistency in quality. Then obsolete production technique, over-dependence on imports, especially woven fabrics, environment and social regulations are few other weak areas in Bangladesh. Particularly, reliability and lead-time in Bangladesh is high as 90-120 days and machinery is mostly outdated unable to keep pace with technological development. Finally, weak marketing and selling techniques had made impossible for any company to develop a brand or have any new market emerged.
Vietnam: In Vietnam product quality needs improvement, as technology and machines are 10-20 years old compared with regional countries, that has put the production costs very high something around 5-7% compared with competitors China, India, Bangladesh and Indonesia. The country imports fabric and accessories demand of the clothing industry and it lacks fashion design badly. High oil prices and being a non-member of the WTO is again a big challenge for its apparel sector.
Thailand: According to the report, most export products of Thailand are commodity types, which are subject to fierce competition and have lower prices. Then the lack of variety and quality products due to shortage of technical manpower and modern technology is resulting in loss of competitive advantage compared with lower cost countries, especially in labour wage rate. The wage rate in Thailand is $1.24 per hour – higher than India, Indonesia, Sri Lanka, Vietnam, Bangladesh and Pakistan. Relying on imported raw materials, the domestic industry cannot supply material, especially quality and variety. High cost of production and difficult to get workers is another big issue there. There is a general lack of skilled people, particularly in the sewing industry, so productivity is not high and investments and industrial engineering are limited.
Sri Lanka: Continued civil war in the country significantly has suppressed the growth potential of the economy and adversely affected investor confidence. The apparel industry there heavily depends on imported raw materials, say 80%, ie, 150 million kgs of fabric are imported annually. The industry has not kept pace with the technological developments. The issue of longer leader times is also hampering growth there. The need to import fabrics results in longer lead times for the apparel industry. The average lead time – 8 weeks or more and lower labour productivity are big weak areas of the industry. The fall is attributed to lower capacity utilization, high labour turnover, absenteeism and under-trained employees and most factories lacks design and product development.
The domestic market there is relatively small with 19 million people and high electricity and fuel costs besides weak supply chain management are main stumbling block there.
Indonesia: In Indonesia, political instability and confusion in the political and social situation, including terrorism, are proving to be major hurdles facing the industry. The infrastructure needs improvement. The rising electricity and fuel costs, increasing trend of minimum wages coupled with low-tech textile and clothing industries is another weak area of the industry. Depreciation in rupiah has increased import costs and oil fuel prices. There is also an increase in the number of labour unions there.
The comparative data below shows some estimates of the size and scope of the apparel markets of eight of the major apparel-producing countries in Asia.
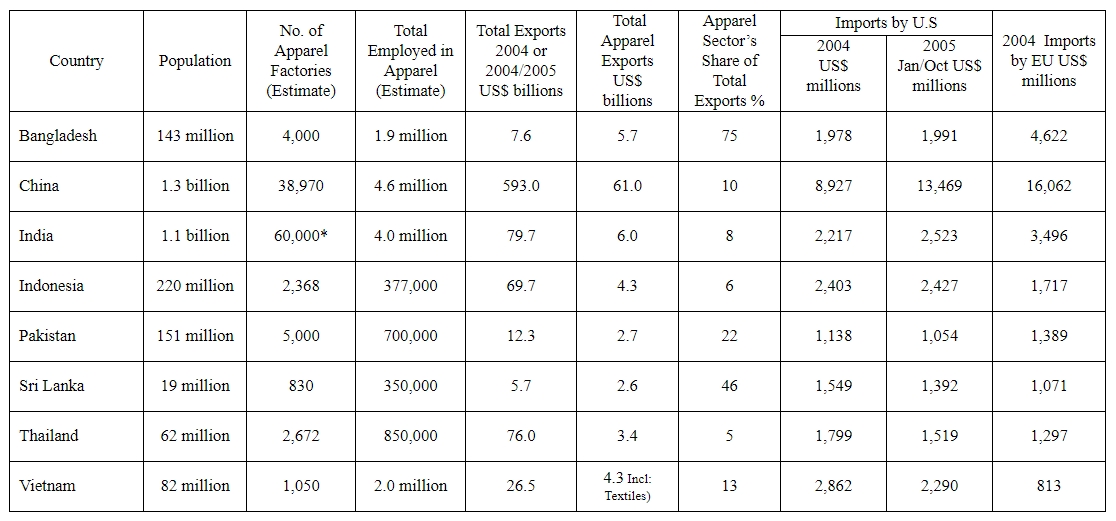
China, Bangladesh, India, Pakistan and Indonesia Takes the Lead
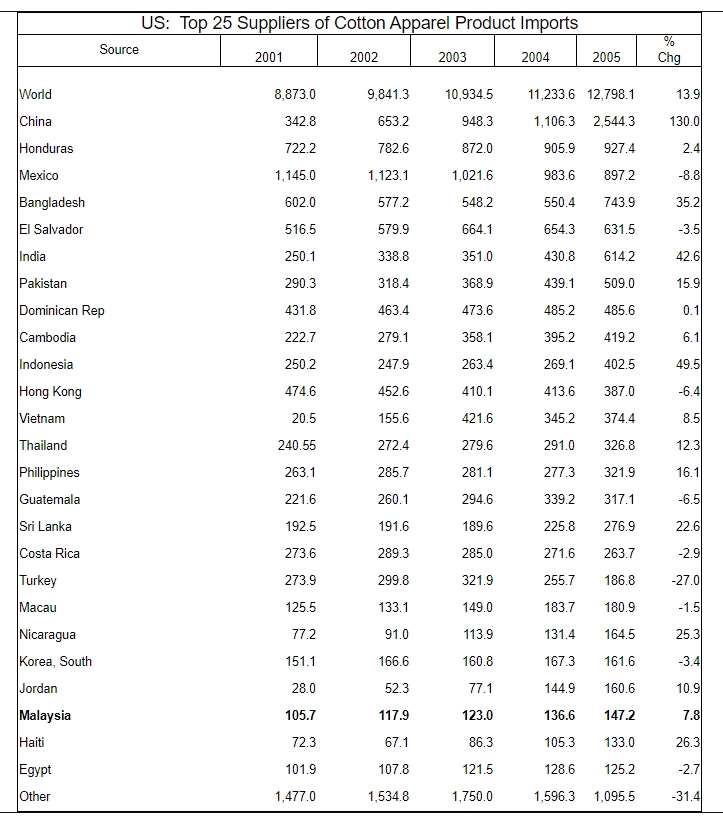
The U.S. imported 41.142 billion U.S. dollars worth of cotton apparel in 2005; this represented 10.01 percent growth in value terms. In quantity terms, the volume expanded 13.9 percent to 12.798 billion square meter equivalents. This was a record, and the import growth was up sharply from only 2.7 percent in 2004 and 13.9 percent in 2005. A clear pattern appears to have developed regarding retailers preference to source cotton apparel.
Despite the mid-year imposition of safeguard quotas on many key products, U.S. imports of cotton apparel from China expanded 130 percent to 2.544 billion square meter equivalents.
Despite duty-free access, the CAFTA/NAFTA region lost significant market share. In many cases, the wide array of obligations placed on these trade deals by the U.S. textile interests have significantly rendered them ineffective. Mexico actually fell to be the third largest supplier of cotton apparel for the first time and may soon fall behind Bangladesh.
U.S. retailers like Bangladesh for cotton apparel. With labor rates below China, its less-developed status and access to duty-free cotton, Bangladesh has carved out a significant market share. U.S. imports of cotton apparel from Bangladesh reached 1.684 billion U.S. dollars in 2005. Its products remain the cheaper, less valued items. In quantity terms, Bangladesh shipped 743.9 million square meter equivalents of cotton apparel to the U.S. This compared to Mexico’s 897.2 million square meter equivalents; however, in value terms, Mexico’s shipments were worth 3.987 billion U.S. dollars.
India exported 2.306 billion U.S. dollars of cotton apparel to the U.S. market, representing 43 percent year-on-year growth. In volume, exports reached 614.2 million square meter equivalents.
Pakistan was the seventh largest supplier to the U.S. in volume, with shipments of 509.0 million square meter equivalents; however, the value of these shipments were only 1.182 billion U.S. dollars, which reduced it to the twelfth largest supplier.
The big story of 2005 was the emergence of Indonesia as a top supplier of cotton apparel. In value terms, Indonesia was the seventh largest supplier, shipping 1.545 billion U.S. dollars worth of cotton apparel to the U.S. market, representing a 47 percent year-on-year increase. In quantity terms, Indonesia was the tenth largest supplier, with shipments increasing 49.5 percent to 402.5 square meter equivalents.
Another country that did not make the top suppliers in either quantity nor value measurements but gained significant momentum with retailers was the Philippines. Cotton apparel exports to the U.S. in 2005 reached 1.182 billion U.S. dollars, a gain of 15.56 percent, it was the fourteenth largest supplier, increasing shipments 16.1 percent to 321.9 million square meter equivalents.
Malaysia managed to maintain its share as the 23rd supplier and with a 7.8 percent gain for 2005 compared with the previous year.
Since China joined the WTO in 2001, it has been accepted wisdom that low-priced Chinese labour will undercut western manufacturers, driving them toward extinction. The rule is, you cannot beat the China Price.
Consider the case of Gildan Activewear Inc., a Montreal-based company competing in an industry that many assumed would be dominated by Chinese manufacturers. Gildan makes T-shirts. In 2005, it manufactured almost 400 million of the things. Textiles is labour-intensive industry. How could a company headquartered in Montreal ever survive?
Predictions of Gildan’s extinction, however, have proven to be more than a little premature. The company is doing quite well in the face of the China threat.
Benchmark Global Clothing Price
The textile-and-clothing sector is a big part of the global flow of goods, accounting for some 7% of the total value of goods traded around the world.
Gildan had begun mapping out a defence to the end of quotas nearly six years ago. The company sent a team of employees around the world to study the global price of clothing. The economic emissaries returned with a wealth of data that executives used to determine the benchmark prices Gildan would have to achieve to stay in business as a global producer. In other words, they figured out what was going to be the new price of a cotton T-shirt, and then they developed a corporate strategy based on that price.
“The first thing we did from Day 1 was to make sure that we benchmarked ourselves against the global market,” says Glenn Chamandy, the CEO of Gildan. “We said, ‘This is where we need to set our selling price,’ and every year from then on we started declining our selling prices in anticipation of getting ready for more of a global market. A lot of our typical North American competitors were dissatisfied with us, but we weren’t viewing them as price setters anymore. We were looking at the foreign competitors.”
Offshore Production
Based in Canada, Gildan’s executives realized that if the company was going to be successful, it was going to have to reduce costs–by going offshore.
It did that in 1998 by relocating some of its sewing facilities to Honduras, followed by Mexico, Haiti and Nicaragua. Gildan also built massive state-of-the-art textile processing facilities in Honduras and the Dominican Republic starting in 2001. The company employs some 10,000 workers, most of them sewers, but also local managers who oversee the operation of each hub, which produces some 375 million garments a year. (The company’s facility in Honduras is the largest such operation in the world.) Wages in Gildan’s factories are still higher than those paid in Chinese factories: the average wage of a garment worker in Honduras is about $100 a week–four times what a Chinese worker makes. But the combination of still relatively low wages and advanced technology has allowed Gildan to lower its price per shirt to below that of Chinese manufacturers. “Today, if you look at our basic wholesale product–a white 100% cotton heavyweight T-shirt–we’re selling it for just over a dollar,” says Chamandy. “The costs for a similar landed product from China today would be 10% to 15% higher.”
Take Advantage of Trade Pacts
But it’s not just inexpensive labour and advanced technology that have allowed Gildan to beat the Chinese on cost. Also important for the company has been a close reading of the mass of bilateral and regional trade agreements. By strategically locating its production facilities in certain jurisdictions, Gildan has been able to ensure that it can ship duty-free anywhere into North America, the EU countries and Australia.
Fast Response
Today retailers don’t like to hold stock. Inventory is expensive, and it takes up time and labour. As a result, retailers have pushed that responsibility onto suppliers. The supplier who can deliver it closest to that date and at the right price is the one who gets the contract. Proximity to the U.S. market is an important advantage for Gildan.
In fact, shipping from China adds about 75¢ to every dozen shirts. To fulfill the requirement for fast response, Gildan has built a network of distribution centres in each of its markets, allowing it to quickly fill client orders. The company has vendor management inventory systems that can ship to customers in 24 hours from the time they place their order. “Our cycle time from offshore is three weeks; from China it’s three months in a container,” notes the company. That fast response time is the company’s secret weapon : “Low labour costs are no longer sufficient to ensure competitiveness in a quota-free market. You have to be close to your end user, and you have to have a good logistics pipeline. Lead time is more important than labour cost.“
A western manufacturer beating the Chinese competition, in one of the most labour-intensive industries on earth, at a time when regulatory barriers have just been pulled down? It can’t be done–except, of course, when it is. In fact, by selling to Australia, where Gildan’s market share has been ramping up, the company is now competing in China’s own backyard. It’s a complete reversal. Gildan–in “something of a show of bravado”–has actually contemplated exporting to China.
A committee has been formed for preparation of a comprehensive action plan for development of knitwear industry, which is under crisis after abolition of quota regime.
A transparent mechanism would be implemented to ensure smooth refund of sales tax. Land would be provided on affordable price to knitwear industry in the textile and garment city projects where land is available with other infrastructure facilities at competitive price.
The Export Promotion Bureau (EPB) should launch a market access programme for knitwear industry and besides the US and EU, the market access in ASEAN, China, Japan, Korea and OIC countries can be explored.
Exports
The removal of quotas under the Agreement on Textiles and Clothing (ATC) in January 2005, has changed the international trading environment for this sector. Malaysia’s exports of textiles and clothing remained resilient in 2005, growing by 6.2 per cent to RM10.3 billion.
In addition, the 2005 growth came on top of a 14.3 percent export surge in 2004 valued at RM9.69 billion over RM8.48 in 2003.
Within the sector, exports of textile constituted 52.6 percent of the overall exports while the remaining 47.4 percent comprised of apparels and clothing accessories.
Exports to the major market of the USA, were unchanged at RM2.9 billion and accounting for 28.5 percent of exports of this sub-sector. Exports to the EU increased by 4.4 per cent to RM1.8 billion. Significant increases in exports, in particular textiles, were recorded to other markets, such as Turkey, the PRC, Syria and India.
Turkey emerged as the second largest market with an export growth of 60.7 percent to RM638.1 million followed by Singapore, UK and Japan.
Imports
Total imports of textiles and clothing increased by 4% to RM5.03 billion comprising mainly yarns, woven fabrics and knitted fabrics.
Major sources of imports of textiles and clothing were China with a share of 29.9% of total imports, Taiwan (11.2 percent) Indonesia (8.5 percent) and Thailand (8.4%).
Malaysia and the United States announced the launch of negotiations for an FTA on 8th March this year at Washington. First round of FTA talks are to start in June and the bilateral FTA is expected to be completed by April next year. In line with the Trade Promotion Act (TPA) in the US, the FTA has to be signed before 30 June 2007.
The negotiations were expected to focus mainly on liberalisation of trade in goods, services and investment, including flexibilities and longer phase-in period for sensitive sectors.
USA Current FTA Partners
Country Effective Date / Status
Israel 1-1-1985
NAFTA 1-1-1994
Jordan 17-12-2001
Chile 1-1-2004
Singapore 1-1-2004
Australia 1-1-2005
Morocco 1-1-2006
DR-CAFTA 1-3-2006
(DR-CAFTA covers El Salvador, Honduras, Nicaragua, Guatemala Dominican Republic, Costa Rica, Colombia, Panama, Ecuador)
Bahrain Awaiting Implementation
Oman To be submitted to Congress
Panama Under Negotiation
Thailand Under Negotiation
UAE Under Negotiation
FTAA Under Negotiation
(FTAA =Free Trade Area of the Americas)
SACU Under Negotiation
(South African Customs Union : Botswana, Lesotho, Namibia, South Africa, Swanziland)
Korea Preliminary Discussions
Malaysia Preliminary Discussions
Egypt Preliminary Discussions
Switzerland Preliminary Discussions
Pakistan Preliminary Discussions
MEFTA Preliminary Discussions
(MEFTA=Middle East Free Trade Agreements)
Besides the above FTAs, US also offer special agreements and preference programs with some regional blocs including the followings :
AGOA – African Growth and Opportunity Act (Expire on 30/9/15)
CBTPA – Caribbean Basin Trade Partnership Act (Expire on 30/9/08)
ATPDEA – Andean Trade Promotion & Drug Eradication Act (Expire 31/12/06)
ATPDEA countries include Bolivia, Colombia, Ecuador & Peru.
FTA Creates Competitive Edge
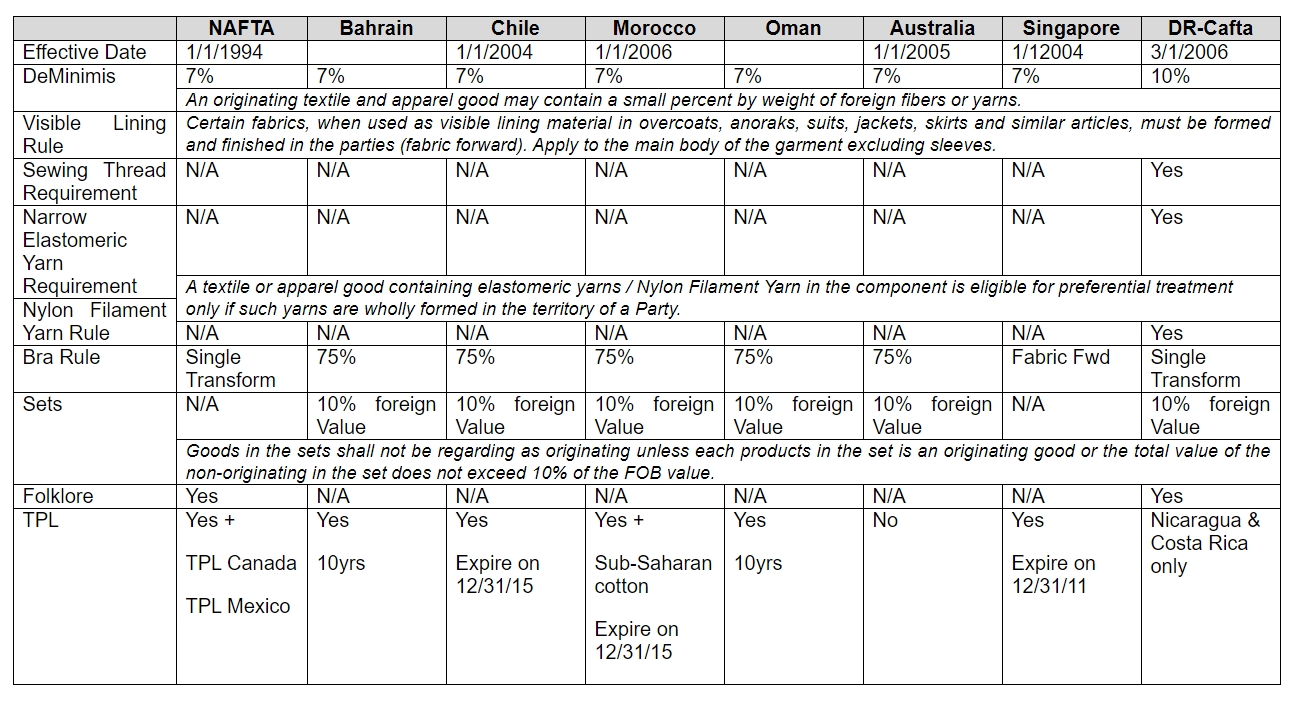
Without quotas, textiles and apparel manufacturers will be searching for a competitive advantage. Without quotas, price will play a major factor in determining who has a competitive advantage. Eliminating duty is one way to reduce the price of a product.
Duty Rates under FTA
Products of FTA countries can be eligible for two or three different duty rates, depending on the inputs (raw material) and production. In regards to the textile and apparel sector, yarn forward is the required rule of origin in most FTAs with US except Jordan & Israel FTAs.
Short Supply
At the request of an interested entity or actual purchaser of a textile or apparel good, fibers, yarns or fabrics not available in commercial quantities among the parties can be sourced from third countries to meet the tariff shift rule.
Tariff Preference Level
Tariff preference level is similar as tariff rate quota (TRQ). A certain quantity of goods can enter during an annual period and receive a reduced rate or duty free treatment even though they do not meet the tariff shift rules. Usually the volume is reduced over a period of time to allow trading partners to integrate.
US FTA Fact Sheet
What is C-TPAT?
C-TPAT is a voluntary government-business initiative to build cooperative relationships that strengthen and improve overall international supply chain and U.S. border security. Through this first worldwide supply chain security initiative, the U.S. Customs and Border Protection (CBP) is asking businesses to ensure the integrity of their security practices and communicate and verify the security guidelines of their business partners within the supply chain. In exchange, CBP provides reduced inspections at the port of arrival, expedited processing at the border and other significant benefits such as “front of the line” inspections and penalty mitigation.
Launched in 2001 with just 7 importers, today 6,000 companies have been accepted as certified partners.
CBP is responsible for screening all import cargo transactions. Utilizing risk management principles, C-TPAT seeks to enroll compliant low-risk companies. The goal is to identify compliant trusted import traders who have good supply chain security procedures and controls to reduce screening of their imported cargo. In turn, this enables CBP to focus screening efforts on import cargo transactions involving unknown or high-risk import traders.
Benefits of Participation in C-TPAT
By participating in C-TPAT, companies will ensure a more secure and expeditious supply chain and benefits including:
CBP expectations for the C-TPAT participant
Certified C-TPAT companies are committed towards the common goal of creating a more secure and efficient supply chain through partnership. Businesses must ensure that their brands, employees, and customers are protected to the best of their abilities.
Foreign Suppliers Requirements
After the importer’s C-TPAT validation, follow-up meetings and site visits are conducted with foreign suppliers and service providers to evaluate their progress against the C-TPAT Security Criteria. As part of this plan to regularly inspect supply chain partners for security compliance, the company will conduct several unannounced on site security inspections. In addition, the company will amend suppliers’ contracts to incorporate minimum security requirements and initiate risk-based audits.
When a C-TPAT certified company out sources or contracts elements of their supply chain, it is imperative that the manufacturer adhere to security measures. The new purchase orders will include the language “Supplier accepts responsibility for factory and container security…..”
International suppliers are required to provide semi-annu al “Business Updates” that include security measures, management changes, employee turnover, policy changes with respect to packaging handling, storage, financial status etc. This information is used to analyze risk, determine contractual compliance, ensure continuity of security measure and need for modifications to security plans.
Only manufacturers who received a passing score in Factory Certification Requirements are permitted to do business with the C-TPAT companies. If a supplier is unable to meet C-TPAT security criteria but is deemed a “critical” supplier by the Company, close scrutinizing the shipments will be conducted to address the supplier’s security vulnerabilities.
Foreign manufacturers will be given formal onsite supply chain security training sponsored by the US C-TPAT certified Company. This training is documented and participants are tested to ensure their understanding of the information taught.
For more information on C-TPAT, please browse the following website :
Textile and Clothing together with electrical and electronic goods, represent the two most dynamic sectors in the global trade. Global export of textiles and clothing during year 2004 were US $453 bn. and of which clothing US $258 bn. Clothing exports which was US $108 bn. in 1990 has increased by 138% during last 14 years.The World Five leading exporters of clothing are China followed by Hong Kong Turkey, Mexico and India. These five Countries accounts for 43 percent of total global clothing exports.
The world five (5) leading clothing importers are European Union, United States, Japan, Hong Kong and Russian Federation. The above countries accounts for 94 percent of total global clothing imports.
With continued increases in world population and global incomes, the textile and clothing industries are expected to grow at 3.2% and 5.3% respectively over the next decade. If the rates of growth are maintained, textile and clothing would be a formidable US $ 600 bn. industry by 2014. (estimates based on 1990-2002 trend by ITCB). The growth promise a potential market share for all efficient producers, including smaller countries who have built reliable long term relationships with their intermediaries.
On 1st of January 2005, the global apparel industry was freed from quota restriction after over 40 years. The elimination of quota also raised the bar, for suppliers, and ability to ship a quality garment on time at a competitive price has became only an entry – level requirement.
The initial trend in the quota free era –
– Increased imports by USA and Japan however decline in EU market due to low consumer spending.
– Continuous dominance of China in textile and apparel trade.
– Emergence of South Asia as an alternative to China as a favoured sourcing destination.
– Exporting from vulnerable countries like Bangladesh, Sri Lanka and Cambodia have increased.
– Prices are down to an extent of 5-8% in almost all the categories.
– Developed Asian countries like Taiwan and Korea and countries dependent on quota have seen fall in exports.
– Leading supply organization in China and selected other countries have seen growth in top line as well as bottom lines.
– Uncertainties regarding safeguard quotas and trade agreements have resulted in buyers/brands, not changing their sourcing destinations to a very large extent.
– Buyers are looking at working on long-term with their vendors than on pure transactional basis.
– It has become a buyer’s market and under pressure from buyers the clothing suppliers are becoming more service providers and offer services that go far far beyond sewing garments.
– Today buyers bring in manufactures of garments at early stage for sourcing to buyers.
The winners and losers in early trends
U.S.A Market
(1) As predicted, China is the major gainer of quota abolishment.
(2) South Asia also has gained market share.
(3) Mexico, AGOA and developed Asian economics are the losers.
In the U.S.A Market, most of the Asian Countries namely China, India, Indonesia, Bangladesh, Pakistan, Sri Lanka, Vietnam, Cambodia etc. has increased their exports to U.S.A Market whereas the Central Latin American and Caribbean country’s, the exports to U.S. Market has decreased during first year of quota expiry. The main countries are Mexico, Honduras, Dominican Republic, Guatemala, El Salvador etc.
The detail imports between during quota year 2004 and first year after expiry of quota 2005 are as follows.
U.S.A Total Imports
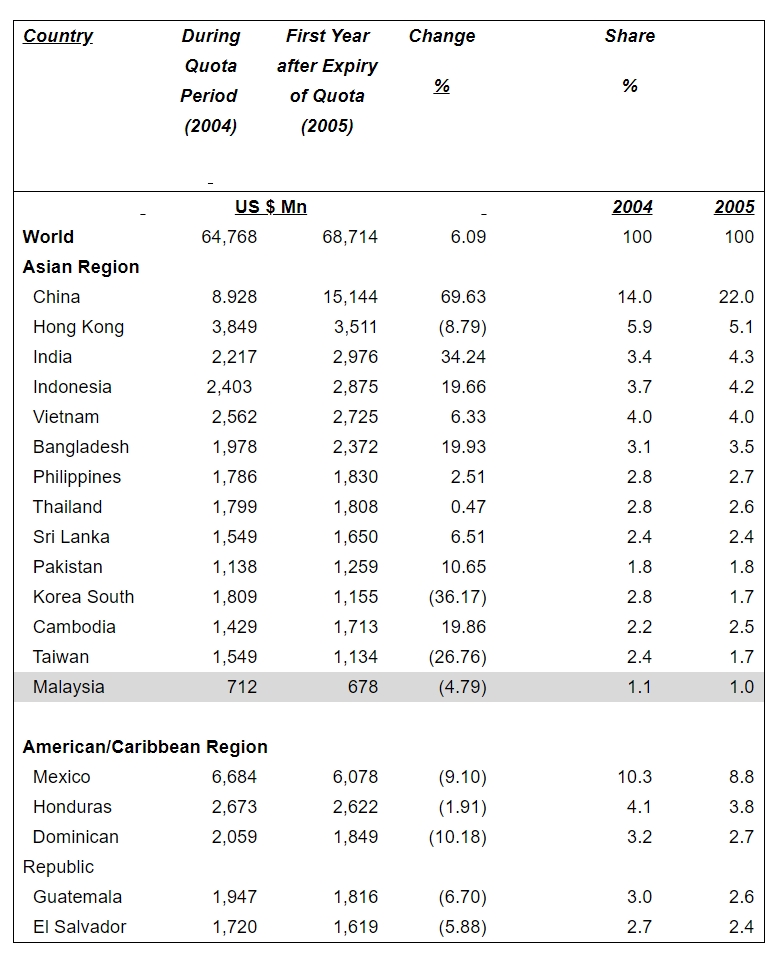
The East Asian countries – Hong Kong, Korea, South and Taiwan shows negative growth mainly because their shifting towards electronics goods as stated elsewhere in the study.
EU Market
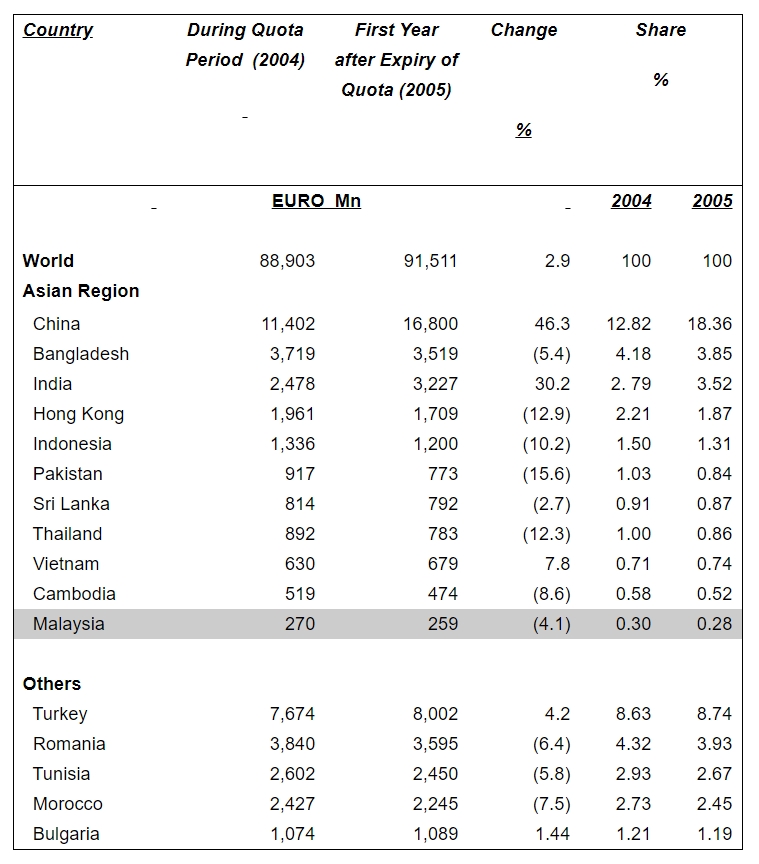
(1) China and India have increased their exports in decreasing market.
(2) Turkey and Bulgaria have also increased their exports to E.U.
(3) Countries like Morocco, Tunisia which at totally dependent on E.U Market has lost its share.
In the E.U Market once again only China and India has shown large increases with 46.3% and 30.2% respectively. Most of the other top exporting countries excluding Turkey with increase of 4.2%, Vietnam – 7.8% and Bulgaria mere 1.4%, has shown decline in exports. China is the major supplier to E.U with a share 18.36, followed by Turkey with 8.74%.
The detail imports between during quota year 2004 and first year after expiry of quotas (2005) are as follows.
EU Total Imports
Measures which will limit China growth in next few years
Post-ATC, China has increased it’s share from 14% to 22% in the USA market and from 12.82% to 18.36 % in the EU market during year 2005.
China is expected to gain a major share in world textile and apparel trade however this rapid growth will be hampered due to-
– heavy dependence on imports of raw material – MMF – Yarn and fabrics,
– rapidly growing domestic market – which consumes about 70% of textile and apparel output by volume. Domestic market growing at a rate of 10-12% per annum.
– No countries would depend only on one country for the sourcing requirements.
The countries to benefit from China’s safeguard measures for USA market
Categories Countries to benefit from safeguards
Cotton Shirts Mexico, Honduras, El-Salvador,
(338/339) Guatemala, India, Pakistan, Bangladesh,
Thailand, Sri Lanka, Indonesia and
Jordon.
Woven Shirts India, Bangladesh, Indonesia, Sri Lanka
Men/Boys and Vietnam
(340/640)
Cotton Trousers India, Bangladesh, Cambodia,
(347/348) Indonesia, Philippines Nicaragua,
Sri Lanka, Vietnam, Jordon, Honduras and
El Salvador.
MMF Knit Shirts Guatemala, Jordan, Turkey, Honduras and
(638/639) El Salvador
MMF Trousers Central American Countries, India,
(647/648) Bangladesh, Indonesia, Jordan, Thailand,
Philippines, Guatemala, and Mexico.
As a result of abolishing of quota on trade in textiles and clothing on 1st January 2005, the prices are falling and major western buyers are narrowing their sources. On a global scale, large Asian countries with vertically integrated industries are becoming the world’s leading suppliers. China in particular can produce textile or clothing item, at any quality and cost.
A recent study reveals that in the post quota era, China and India will emerge as the biggest gainers in terms of international market share 50% and 15% respectively in the United States, 29% and 9% in the E.U. The rest of the world is striking, and now South Asia will be the world’s second most competitive region after China.
The study implies that Asian – LDC’s, who has an advantage of quotas will be hardly hit. This implication for countries like Cambodia, Nepal, Bangladesh thus it is, projected to be difficult.
Another study assesses country situations by scrutinizing three forms of costs. Direct Cost (fabric, labour), Indirect Costs (facilities a factory can offer on preproduction, technology aided design assists, sampling labs, efficient communication and sourcing information) and Country Costs (not having duty-free market access, proximity to customers, able human resources, business friendly environment and good logistics). The combination of indirect and country costs is much more important than the direct costs advantages on labour and other items. The clear winners in studies are those that enjoy indirect or country cost advantages or a combination of both (China, India, Turkey, Italy). Potential country cost winners also are those that enjoy preferential access to major market. (Mexico, CAFTA).
Other Factors
Under pressure from buyers the international garment industry is now moving towards as s service industry and what the buyer/retail companies- is used to do yesterday, the garment manufacturer has to do today.
Another country which benefited immensely from tariff preference is Jordon. In year 2000, its apparel exports to USA was only US $ 42 mn. and after spinning the Free Trade Agreement with the USA in 2001, its exports to USA in 2005 has reached US $ 1,083 mn. making a growth of 2,578%. This underscore the fact that countries enjoying preferences have a head start and Asian Countries that are nowhere near to enjoying comparative preferences are disadvantaged. Although Singapore has recently signed on FTA with the United States, its Apparel Industry is insignificant.
The countries that are most competitive by Virtue of Scale, Cost and Capacities and that are vertically integrated with the rest of the production chain including the ability to offer supplementary services.
The countries that are moderately competitive are beneficiaries of tariff preference, Niche expertise and shorter distance to major markets.
Potential exists for even small countries to orient their upgraded capacity towards Niche markets. Eg. Sri Lanka and its world class production of one such Niche item – lingerie.
The sourcing of apparel items also will depend on the type of product. The element of fashion is linked to issues of replenishment. The decisions made by sourcing agents in single season products with limited prospect of replenishment such as women’s dresses, traditional costs and tariffs would be influential, whereas for products requiring in continued replenishment, such as men’s trousers, issues related to lead time, inventory and shorter distance could be influential.
Mounting competition at the distribution end of the pipeline is prompting distributors to shift towards lean retailing, which requires frequent deliveries and continuous monitoring of sales form suppliers, in an effort to adjust product assortments. This is turn makes it imperative for suppliers to build up information channels and obtain access to point-of-sales data.
It is also seen that many Asian manufacturers are moving from (CMT) manufacturing into Free on Board (FOB) and especially, the fully-fledged fashion producers of Asian countries.
It is important for effective supply chain management to take into consideration all conditions that determine competition. Labour cost being only one of them, others are tariffs, transportation, market proximity, infrastructure and services from utilities, environmental impact of production processes, labour standards and in particular lead times.
Comments from Buyers and Suppliers
Buyer
· With quota expired, we are looking at negotiating better prices with our Vendors, however, price is not the only criterion on which we base our sourcing decision.
· Prices have decreased by 5-6% in many categories. This is an ongoing phenomenon. But with quota gone, price competition has become intense.
Supplier
· Most categories have seen a price drop at 5-7%.
· We are experiencing tremendous pressure on margins. Volumes are up but our bottom line is impacted.
· Most of our buyers are increasing orders but also negotiating for a price review.
The garment supplier in the developing countries, now should understand the new rules of the game and learn to play efficiently and effectively if so, to survive in this fast growing industry which is now almost controlled by the buyer.
(The writer is a Chartered Marketer who has over 25 years experience in textile and clothing sector and conduct studies on textile and clothing sector and contribute articles to National and International magazines. E.mail address-ahhsaheed@sltnet.lk or saheed@dialogsl.net )
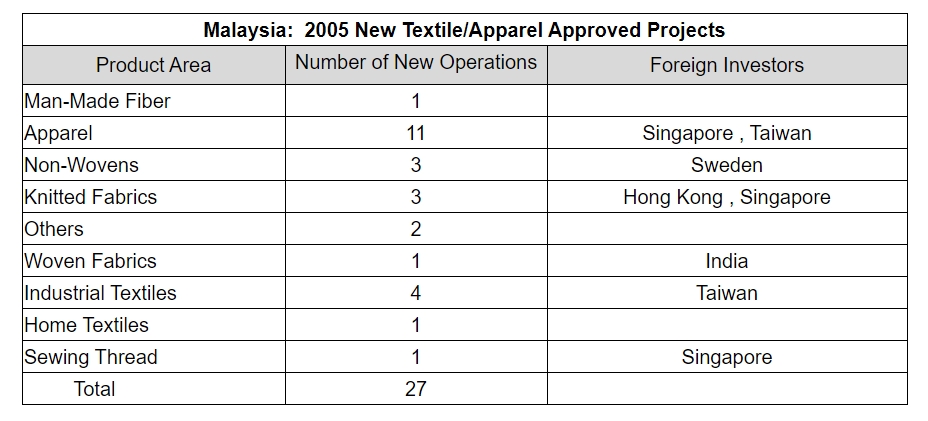
The entire textile sector drew investors in 27 new projects in 2005, with foreign investment from Singapore, Taiwan, Hong Kong, India and Sweden; the largest investment was in apparel followed by industrial textiles.
Total textile and apparel production is expanding–first quarter output was up sharply. January output expanded 7.9 percent from the previous year and was followed by a 19.4 percent surge in February. The driver is both domestic sales and exports. January textile, apparel and footwear exports expanded 7.5 percent to RM916.6 million and were followed by a 10.9 percent expansion in February to RM809.1 million. Cumulative January through February exports were up 9.1 percent.
January through February exports to the U.S. market expanded 13.7 percent to 57.39 million square meters. The growth is both in apparel and MMF non-apparel products.
The consumption of cotton appears to be improving, led by an increase in cotton fabric output, which is being absorbed by soaring apparel output. Cotton fabric output fell 10.2 percent in 2005 but is now rebounding. January through February cotton fabric output posted 13.2 percent year-on-year growth, reaching 26.139 million square meters.
In the apparel sector, output experienced 35.9 percent growth in 2005 to 70.193 million pieces. This has been followed by January through February 2006 cumulative expansion in output of 46.6 percent, reaching 13.444 million pieces. Malaysia has proven successful in boosting its apparel exports to the Islamic markets; exports to Turkey, Syria, Egypt, Pakistan and the United Arab Emirates are rapidly expanding.
China’s very influential National Development and Reform Commission have released its new five year plan and goals for the textile and apparel industries. Since the textile and apparel sectors are now privatized, the plan is a reflection of government policy towards the industries. Overall, the new five year plan for 2006 through 2010 will emphasize a move from a focus on quantity to quality.
It is interesting to note that higher quality exports will be encouraged with 2010 textile and apparel exports targeted at 750 billion U.S. dollars, representing a 50 percent increase over the levels of 2005.
The plan will include:
* Improvement in textile machinery and technological products.
* Buying international brands.
* Create own brands.
* Using optional fibre.
* Reducing the use of energy sources.
* Speeding up reform of state-owned textile enterprises.
* Promote innovation in technology.
* Set up several huge textile parks in various provinces.
Key Points of the 5-Year Development Plan
~ Improve quality, switch to value added products and develop brands.
~ Increase textile/apparel exports by 50% by 2010 to 750 billion U.S. dollars.
~ Spinning output growth upgraded at 6% annually through 2010. Total domestic consumption of fibers targeted at 36 million tons by 2010.
~ Domestic textile/apparel sales target to increase 12.7% annually.
~ Total annual fiber output increase from 15.29 million to 24 million tons.
~ Total yarn output to expand 5% annually from 14.4 million to 18.5 million tons.
The US Customs and Border Protection (CBP) has recently issued an informed compliance publication (ICP) entitled “What Every Member of the Trade Community Should Know About: Marking Requirements for Wearing Apparel”. The ICP provides guidance and useful information on the marking requirements for textile and apparel articles imported into the US.All wearing apparel items must be marked with the name of the country of origin by means of a fabric label. In the case of garments that cover the upper torso such as shirts, blouses, coats, sweaters, dresses and similar apparel, country of origin marking must be placed on the “inside center of the neck midway between the shoulder seams or in that immediate area”.
Trousers, slacks, jeans, shorts, skirts and similar wearing apparel must be marked by means of a permanent label affixed in a conspicuous location on the garment, such as the inside of the waistband.
The Federal Trade Commission (FTC) is responsible for enforcing the Trade Regulation Rule Concerning the Care Labeling of Textile Wearing Apparel, which requires a permanent label that provides care instructions on all wearing apparel, unless there is an exemption (e.g. gloves).
Gloves
Customs has held that bulk packages of work gloves (usually 1 dz. pairs to a poly bag), which are given to employees, may be excepted from individual marking provided that the gloves in outside containers (poly bags) properly marked with the origin of the gloves. Gloves that are not contained in a poly bag but are fastened only by a paper band which may easily become detached or ripped from the gloves, may not be excepted from individual marking. However, Customs has held that cloth work or garden gloves may be marked to indicate the country of origin by means of a heavy paper folder which securely fastens the gloves together. Gloves may be marked with a hang tag instead of sewn-in labels or ink stamps.
Textile Fiber Identification Act
Textile and apparel articles imported into the United States are required to be marked or labeled pursuant to the Textile Fiber Products Identification Act. These acts are enforced by the Federal Trade Commission (FTC). The following are some of the information to be included in English:
• Fiber content, by percentage in descending order by weight, using generic fiber names
• The name of the country of origin of the product
• The name of the importer, distributor, retailer, or foreign manufacturer
• The responsible firm may be identified by its trademark name, provided that the trademark name has been registered with the U.S. Patent Office and a copy of the trademark registration has been furnished to the FTC prior to its use.
For details, please browse the following web :
http://www.cbp.gov/xp/cgov/toolbox/legal/informed_compliance_pubs/
The Japan-Malaysia Economic Partnership Agreement (JMEPA) came into force on 13 July 2006 . With the implementation of JMEPA, products entering Japan on 13 July 2006 and thereafter, that are eligible for preferential tariffs will have to be accompanies with a Certificate of Origin ( Form MJEPA ) endorsed by the Ministry of International Trade and Industry. For textile and apparel products, tariffs are eliminated with immediate effect.
Rules of Origin for Textile and Apparel Products
Procedure to Obtain Preferential Tariff
1) STEP 1: Application for product cost analysis.
1.1) Documents to be submitted:
i. Application Letter;
ii. Completed forms MJEPA 1, MJEPA 1A, MJEPA 2, MJEPA 2A; ( These Forms can be downloaded from MITI website or obtained at MITI office/branch counters.)
iii. A certified true copy of Company Registration Certificate (Form 9)/(Form D);
iv. A certified true copy of raw material invoices;
v. Product sample/Catalog/Picture;
vi. Processing Flow Chart
1.2) Processing of the application is within 7 working days from the date of completed application received.
2) STEP 2: Endorsement of Certificate of Origin (Form MJEPA)
2.1) Documents to be submitted:
Application before shipment
i. A copy of MITI’s Approval Letter;
ii. Completed MJEPA form;
iii. Invoice;
iv. Packing List;
v. Completed form MJEPA 3 (2 copies);
Application after shipment
i. A copy of MITI’s Approval Letter;
ii. Completed MJEPA form;
iii. Invoice;
iv. Packing List;
v. Bill of Lading;
vi. Customs Declaration Form ( K2 );
vii. Completed form MJEPA 3 (2 copies);
2.2) Endorsement of Form MJEPA is within 3 working days from the date of completed application received. The Certificate of Origin (MJEPA form) can be purchased from Federation of Malaysian Manufacturers (FMM)
3) Application for product cost analysis and Endorsement of Form MJEPA should be submitted to MITI (HQ) or Branch Offices in respective states.
Material Utilisation (MU) is one of the key performance indicators as it constitutes about 58% -60% of total production cost in the apparel industry. As many companies generate waste equivalent to 15-20 percent or more of the total material purchased; a 1 percent saving usage could yield a profit increase of 8% – it is an area to be considered as a source of profit improvement.
What is Material Utilisation?
The absolute measure of material utilization can be summarized as: “the number of meters of fabric and trim purchased by a company to achieve delivery of the required number of perfect garment to the customer”.
Typically, areas of the business, which have an impact on MU are :
MU Performance Measures
Basically, MU performance measures in the apparel industry focus on :
Production Planning – To know the fabric characteristic and performance. The key performance measured is the percentage of Cut vs Order.
Marker Planning – Time is a crucial factor.
Cutting Room Performance – In typical cutting flow, an audit is done on spread losses upon completion of the spreading process. Fabric loss monitoring is mainly from various spread losses including : End loss, Splice loss, Gap loss and Width loss.
* Remnants Control – To analyse the nature of remnants fabric after cutting and sewing as well as surplus unshipped finished garments. Therefore, it is important to know the characteristic and performance of fabric.
* One of the important process in cutting room quality control is cut piece inspection process. The process provides accurate indication of fabric quality. All defects must be recorded and standard should be set up for minor defects.
Production Performance – Factors in garment production performance measurement :
* Inferior Garments * Fabric defect * Sewing defect
* Shade issues * Unshipped garments
* Unaccountable * Balance Stock
Overall Performance – Material management is managed not only by the material related department, but it is also the responsibility of all. Firms must have proper understanding of incoming material; and corrective action to produce garments that balance with quality and price.
Best Practices
A. Working Closely with Fabric Mills
Both suppliers of fabric and apparel manufacturers look and discuss on ways and share experiences in solving garment related problems i.e. mending, fabric touch up, refinishing etc.
B. Pre-Production– Among the two critical factors are maximize cut to order (%) and surplus management.
C. Fabric Inspection
* Inspection System – Set up a standard 4 point inspection acceptable system.
* Shade Evaluation – Evaluated on the color continuity between rolls and sides and color difference.
* Check on bow, skew and any distortion.
* Check for stripes repeat.
* Roll length verification.
Based on all the above factors of fabric inspection, the Computer Maker Department (CMD) will be advised on the re-cut allowance estimated.
D. Computer Maker Department (CMD)
CMD receives and analyses information from Fabric Inspection. CMD then arranges and plots marker. The KPIs evaluated are :
* Size per marker (Long marker)
* % of Utilization and Yards per Dozen (YPD)
* Fabric defect / shade defect analysis
E. Spreading and Cutting
The benchmark standard for a world-class material management manufacturers is the losses after cutting should be within 1% – 1.5%.
F. Cut Piece Inspection
* Sets standard according to buyers’ criteria.
* Educates the cut piece inspectors on mending re-cut/ replace and what is the acceptable standard.
* Sampling on cut piece standard is done.
G. Post Production
During this stage, two critical success factors are ship to cut and ship performance.
* Ship-to-cut Analysis is made to ensure that is it as close as 100%. Inability to achieve 100% will result in production waste, sample, fabric fault and balance stock.
* Ship performance.
Conclusion
Among the waste streams often categorized as primary and secondary associated with an apparel firm are :
Apparel Manufacturing –Primary Waste
* Fabric remnants * Samples * Sewing thread
* Cutting or scraps * Trimming * Mill end
Apparel Manufacturing –Secondary Waste
* Waste * Tubes * Paper waste
* Pallets * Bags * Cones
*Plastic wrap * Shipping cartons
“Waste prevention is on obvious solution”. The American Textile Manufacturers Institute’s survey of 36 companies and 260 plants showed that after implementing waste reduction practices, the total amount of waste generated per plant per month decreased significantly.
Advances in computer-aided design have helped companies lower their costs. Strategies could be used to decrease fabric waste through changes in technology and operations.
Textile/Apparel Exports Expand 8 Percent in Q1
Malaysia’s textile and apparel sector export expansion continued in the first quarter of 2006. January through March exports reached RM2.631 billion, representing an 8 percent year-on-year expansion.
Apparel Production Surges 42.3%
Malaysia ’s apparel industry is operating at record capacity and has proven itself successful in competing in the post 2005 world. Apparel production in 2005 expanded 35.9 percent reaching 70.193 million units. First quarter 2006 production expanded an additional 42.3 percent to 18.788 million units. Textile output expanded at a slower pace. Exports continued to expand to a variety of destinations.
May Output Rise
May output reached 7,937,000 units of clothing, which was double year-ago levels. Cumulative January through May apparel output was up 52.4 percent from a year earlier at 32.771 million units. May cotton fabric output reached 16.117 million meters, representing a 28.0 percent year-on-year expansion. Cumulative January through May cotton fabric output expanded 4.7 percent to 67.696 million meters. Cumulative January through May exports expanded 15.9 percent to RM4.707 billion.
The largest markets were the United States, European Union, Japan, Singapore, Hong Kong and Turkey. In the U.S. market, Malaysia has significantly expanded its exports of man-made apparel; these are up 2.0 percent in volume, but 25.9 percent in value terms. Malaysia has also increased shipments to the Middle East.
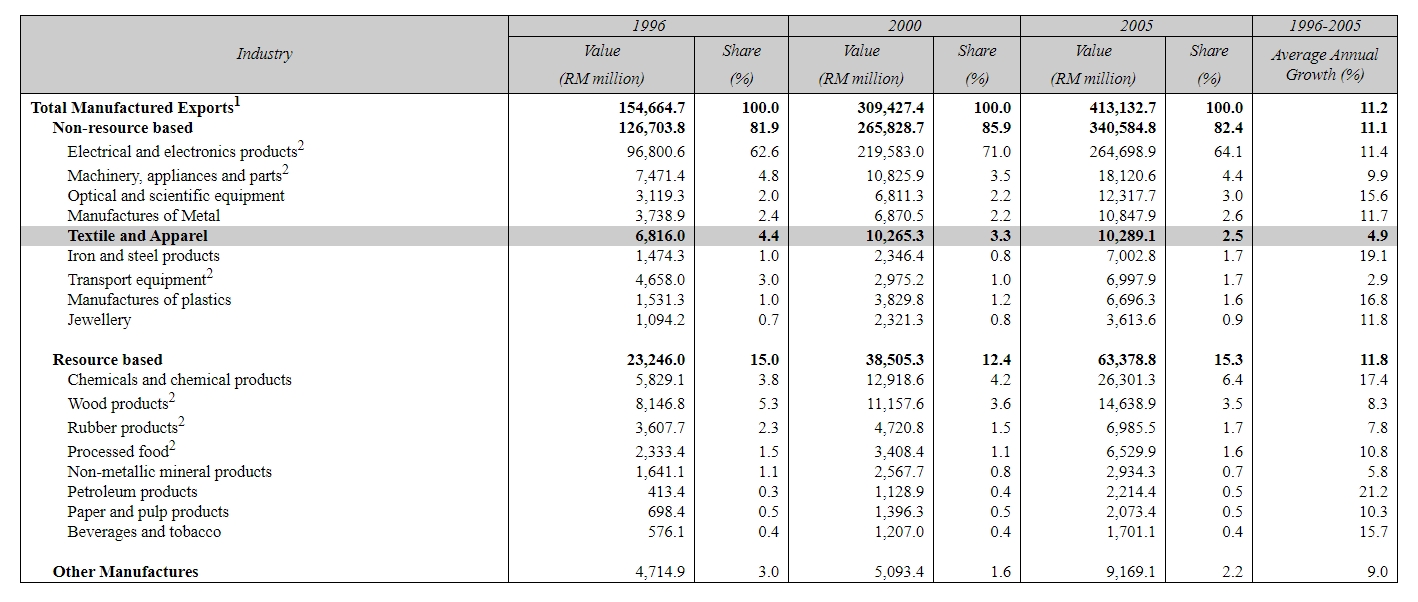
Notes:
1. The value of the total exports of manufactured products, compiled by Ministry of International Trade and Industry (MITI), differs from the value of the total export of manufactured products contained in the Ninth Malaysia Plan, due to the difference in product groupings adopted by MITI and Economic Planning Unit (EPU).
For example, in 2005, the figure by MITI was RM413.1 billion, while the figure by EPU was RM429.9 billion
2. Export values in this Table differ from the export values of the targeted growth industries, due to differ coverage in the product groupings
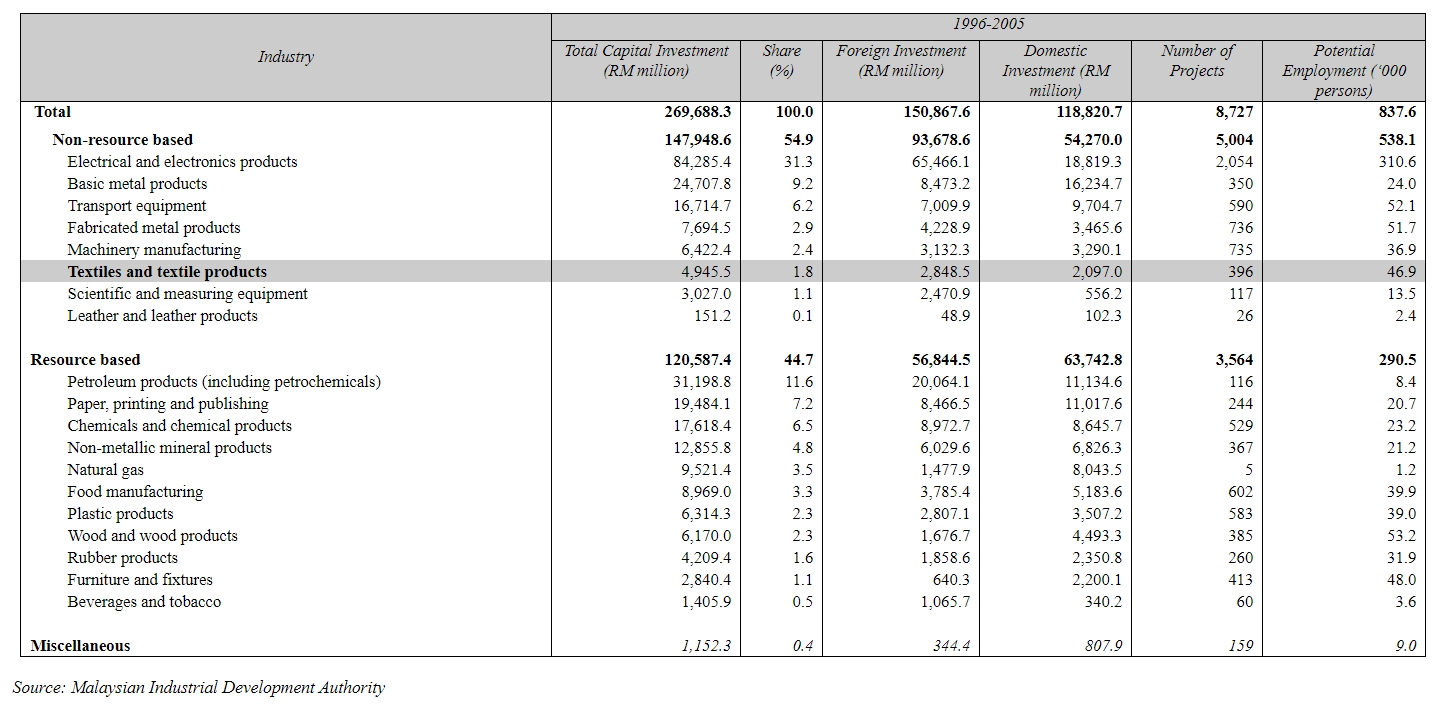
Four of the suppliers posted gains in China’s import with Macao and Hong Kong showing a faster growth of 18.5 percent and 57 percent respectively, but Japan’s export to China fell 11.4 percent.
China’s top five importers for apparel and clothing accessories are Guangdong, Shanghai, Liaoning, Jiangsu and Beijing, the summation from the top five possessed 88.8 percent of the country’s total import.
Among which the share of Guangdong alone seized 55.8 percent. Both gains from Guangdong and Beijing exceeded 20 percent, while Jiangsu’s import subdued.
China has emerged as the manufacturing powerhouse for the West. Its factory converts raw materials into products for the world. Its people represent a new consumer market for those goods.
For apparel alone, Chinese consumption could exceed that of the US by year 2030. Brands and retailers must realize that as far as marketing goes, East is definitely East. Understanding how the Chinese shop is key.
The buying habits and preferences of the Chinese consumers were the focus of the recent survey. Data was collected through interviews with 7,000 people across China.
Top ten key learning of the research:
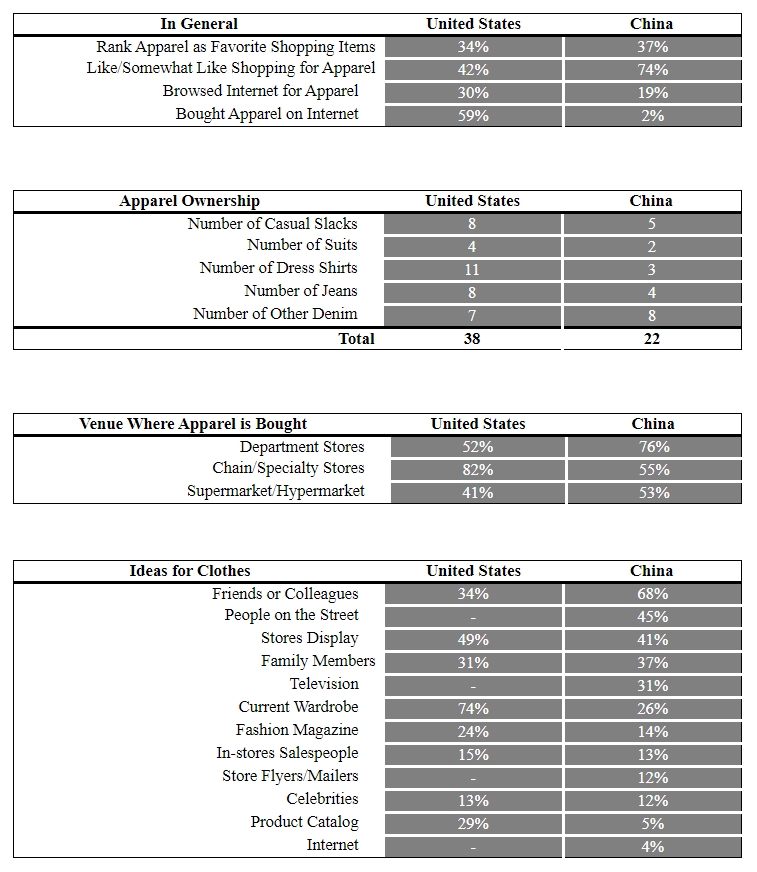
U.S. imports of cotton textiles and apparel surged 11 percent in August, reaching 2.071 billion square meters. The growth was led by a surge in imports from China (+30 percent), India (+18.6 percent), Bangladesh (+23.3 percent), Honduras (+10.5 percent), Indonesia (+43.1 percent), Vietnam (+35.2 percent) and Cambodia (+25 percent). Imports from Mexico and Canada continued to weaken, and imports from Canada plunged 40 percent to only 25.6 million square meter equivalents. Pakistan remained the second largest supplier to the U.S. market but appeared to be losing momentum to India. August imports from Pakistan increased only .4 percent.U.S. cotton textile and apparel imports in August had a value of 4.797 billion U.S. dollars. China remained the top supplier in August, with 28.78 percent of the market. India is continuing to expand its market share in the U.S., driven by made-up and apparel exports. India is the fifth largest supplier of cotton apparel to the U.S. market and appears likely to move ahead of Mexico and possibly even Honduras before the end of the year.
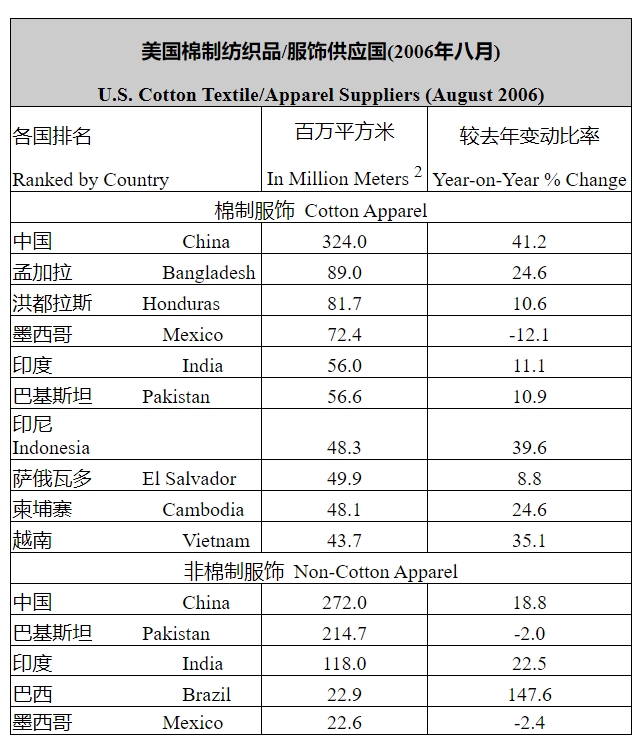
Indonesia’s textile and apparel producers are confronted with a surge in illegal imports from China. Corruption is the main reason behind the rising share in foreign products on Indonesia’s domestic market. And there is no improvement in sight, at least in the near term.
Generally speaking, the export-oriented companies were quite happy about the current state of affairs, while the domestic-oriented garment manufacturers were whining.
Exporters explained they are mostly working at full capacity while other apparel makers complained they suffer heavily from illegal imports.
Illegal imports from China
Chinese imports, most of them consisting of allegedly smuggled goods, have in a brief time conquered the Indonesian domestic market. According to the National Textile association API, the share of domestic production in Indonesian consumption of textile goods (mainly garments) plummeted from 72% in 2002 to around 25% in 2005.
Although the Government has taken some measures to stem the influx of smuggled imports, the domestic market reportedly continues being flooded by unbelievably cheap Chinese goods.
Abel Huang, Sales Manager of the Chinese home textile manufacturer Shunjin Textile, explained: “For sending one single 40 Ft container with textile goods to Indonesia, normally a sum of US$18,000 of import taxes has to be paid. Fortunately, this is not our problem. We have only to send our goods to Shanghai. Then, another company takes over which knows how to deal with corrupt Indonesian customs.”
API as well as the Indonesian Chamber of Commerce and Industry (KADIN) have frequently but unsuccessfully urged the Government to protect the domestic market from Chinese imports by installing safeguards.
According to API, Indonesian import tariffs are very low. They stand at respectively 4% and 5% for cotton and synthetic fibers, at 5% for yarns (10% for special yarns), at 10% for fabrics (15% for special fabrics) and at 15% for garments.
US-Indonesian Deal to Stop Illegal Textile Trade
On the other hand, the United States and Indonesia signed an agreement on 26 September 2006 to stop clothing from China, Vietnam and potentially other suppliers from illegally entering the U.S. market as Indonesian goods. Transshipments have jeopardized Indonesia’s legitimate textile and apparel exports by taking up market space in the United States.
The new memorandum of understanding provides for customs cooperation between the two countries and allows for joint verification visits to ensure clothing and textile imports from Indonesia are legitimate.
In Shanghai, there are 6 clothing-related schools. Some designing students do not have many opportunities to learn the sewing process in school. Such students visit this training centre during their summer vacation and receive training on garment production process.
On the other hand, the technicians who handle sewing machines and the operators who work in sewing factories also visit this training division and upgrade their techniques. Curriculum is divided into 5 levels. Level 1 is a 250-hours course on the manufacturing process of jackets, trousers, etc. and level 2 requires 300-hours training of marker making. At level 3, trainees learn CAD/CAM and more complicated sewing techniques in 400 hours. Level 4 (second level) and level 5 (first/top level) are training courses for the chief technicians, each taking 320 hours.
The textile sector has seen output weaken in recent months as apparel manufacturers focus on imported fabrics.
Domestic production of cotton fabric fell 8.5 percent in July to 12.701 million meters. Monthly output of cotton fabric has fallen in four out of the past seven months. Year-to-date output is flat, increasing 1.6 percent to 78.995 million meters. Despite a 35.9 percent increase in domestic apparel production in 2005, domestic output of cotton fabric decreased 10.2 percent.
Under the Malaysian Third Industrial Master Plan (IMP3) 2006-2020, 12 industries in the manufacturing sector have been targeted for greater development and promotion. These industries have the potential to contribute to the further growth and exports of the sector. They will contribute in diversifying industrial activities and enhancing the resilience of the sector, to enable it to take advantage of growing markets, regionally and globally. The targeted industries are:
Non-resource based
I. Electrical and electronics;
II. Medical devices;
III. Textiles and apparel;
IV. Machinery and equipment;
V. Metals industry;
VI. Transport equipment; and
Resource based
I. Petrochemicals;
II. Pharmaceuticals;
III. Wood-based products;
IV. Rubber and rubber products;
V. Oil palm-based industry;
VI. Food processing.
According to a report, the constraints of most SMEs in facing the globalization including shortage of capital, market information, language command, government policies, payment collections and human resources. However, the most critical withdrawing factor is the breakthrough of concept and mind. Once the mindset is opened and determined to shift from defense to attack, the driving force will eventually cleared all obstacles.
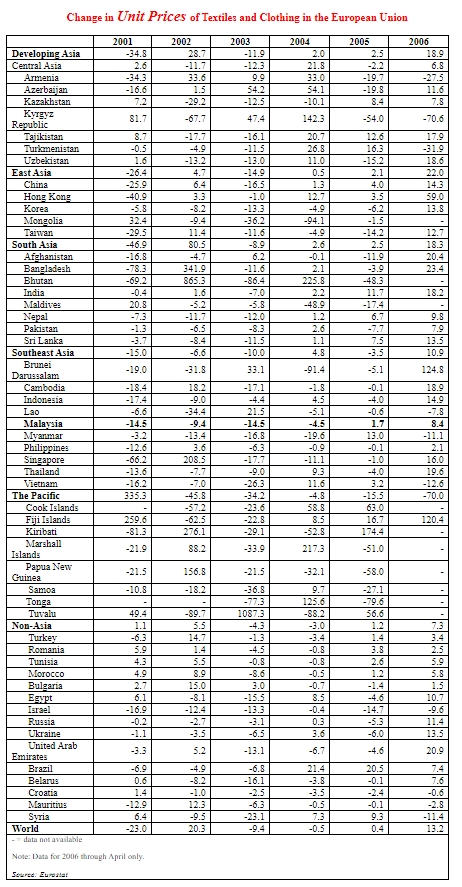
There were, concluded the speaker, many systems for quality on the market. The one with the future must be an independent party in the middle (between supplier and buyer), like a bank, where the client could not enter. Such a system supplier would only open the door, so as to speak in the case of a claim or similar, as the garment supplier invariably had intellectual property which could not be revealed to all parties. The cost of a supply chain management system is about 1-2% of the FOB cost, and secure quality is essential for business.
Phongsak Assakul – AFTEX Chairman
Mr. Phongsak Assakul reminded of the many fears and concerns as a consequence of the unfamiliar territory ahead. As a consequence, the ASEAN countries developed their road map, urging factories to shorten their lead times and become more flexible, to meet the requirements of the post-MFA era. Major changes including the incorporation of colour, style and trend information in collections for buyers. Besides, trade and investment agreement with the US would ensure survival down the road.
“Reaction : Dynamic / Shifts in Global Sourcing in View of Bilateral and Regional FTAs” by Marc Compagnon, Executive Director, Li & Fung
With a business worth about US$9 billion, Li & Fung is the largest trading group in the world today, and the annual growth rate is about 23%. The reason for continued growth is the continued emphasis of the company on service.
Li & Fung now supply to about 100 countries and sources from approximately 14,000 manufacturers in about 40 countries.
According to the speaker, in spite of fundamental problems including quota and inflationary cost pressures, China was among the winners. Southeast Asia region had also experienced 40% growth since WTO, specifically in Bangladesh, India and Pakistan. Losers were in Africa, Latin America and the Middle East. Business in Central America has shifted to being totally vertical, using US yarns “or not”.
Indonesia, which he termed “the sleeper” was underutilized as US buyers tended not to go there, but the apparel side had seen dramatic changes, and the industry was competitive.
Malaysia as a supplier was “steady” but might go forward due to the FTA. In the Philippines, business had grown steady and would continue to play a significant role. Singapore was, for Li & Fung, an important sourcing office but the production there was very small.
Thai business was steady and “creeping up” and particularly strong in niche products such as children’s and performance wear.
On the subject of whether FTAs / bilaterals will affect buyer’s preferences or supplier’s competitiveness, the speaker noted that strategic sourcing differs by customers or buyers, and the issues were those of cost versus reliability, as well as lead times. Lead time is most important in this business, and the buyers need most fashionable merchandise as well as low prices.
The Annex to Directive 2005/84/EC restricts the use of phthalates commonly referred to as DEHP, DBP and BBP at concentrations of greater than 0.1% in toys and childcare articles which can be placed in the mouth of children. Such toys and childcare articles shall not be placed on the EU market.
FTA between Malaysia and Pakistan is expected to be signed by year-end and implemented in 2007. Malaysian businessmen have taken advantage of the Early Harvest Programme (EHP) signed by KL and Islamabad in October last year.
For the January-August 2006 period, Malaysia has exported RM24.3 million worth of products to Pakistan, mainly petrochemical products, oleic acid and rubber.
The EHP covers products with most favoured nation (MFN) tariffs of 10 percent and below while products with MFN tariffs of 5 percent are eliminated. 40 Malaysian companies are doing business in Pakistan.
Malaysia’s offer to Pakistan covers 114 tariff lines which include yarn, textiles and clothing while Pakistan offers 125 products such as electrical appliances, machinery, plastic products, chemical, rubber and timber products.
On the Malaysia-Pakistan FTA negotiations, Malaysia has requested reduction in import duties on motor vehicles and palm oil.
Pakistan and Malaysian governments agreed to work to boost bilateral trade to US$1 billion annually from the current US$730 million. Both countries also agreed in principle to set a joint investment company to promote investments in Pakistan and vice versa.
Rules of Origin for Textile and Apparels : Product Specific Rule (PSR) Criteria
“Product Specific Rules” are rules that specify that the materials have undergone a change in tariff classification or a specific manufacturing or processing operation, or satisfy an ad valorem criterion or a combination of any of these criteria.
It is proposed that PSR be applied on textile and textile products and products which have undergone sufficient transformation in a Party shall be treated as originating goods. Products which satisfy the Product Specific Rules shall be considered as goods to which sufficient transformation has carried out in a Party.
The following processes can be considered as sufficient transformation:
and
A detail description of textiles under products specific rules is available for viewing on MKMA website.
Section 25 of the Pembangunan Sumber Manusia Berhad Act, 2001 states that an employer shall lose his eligibility to receive any financial assistance or other benefits under the Human Resources Development Fund (HRDF) if they do not make any claims within the stipulated period as determined by the Board. In this regard, the stipulated period as determined by the Board is five years and will be effective from 1 January 2002 to 31 December 2006 .
Levy paid for the 5-year period, effective from 1 January 2002 (including levy paid before 1 January 2002) would be forfeited if employers do not make claims for financial assistance or other benefits within the 5-year period, effective from 1 January 2002. This 5-year period will subsequently continues, i.e. from 1 January 2003 to 31 December 2007 , 1 January 2004 to 31 December 2008 , 1 January 2005 to 31 December 2009 and so on.
To avoid levy paid by employers from being forfeited after the lapse of the 5-year period, employers are requested to apply for financial assistance and submit claims before 31 December 2006. Failure to do so will only result in the entire levy balances in employers’ accounts on or before 31 December 2006 be forfeited on 1 January 2007.
Employers who have not make any claims from PSMB and only apply for financial assistance, the last date for them to submit claims is 31 December 2006 and not 30 June 2007.
Please Logon to www.hrdnet.com.my or contact the Human Resource Development Council for further clarification. (Tel : 03-2098 4800、Fax : 03-2093 5722)。The MKMA secretariat is always available to cater and tailor made courses according to the needs of your company.
Wrap is an independent, non-profit corporation dedicated to the certification of lawful, humane and ethical manufacturing throughout the world.
WRAP certification is a program of independent factory certification, which ensures that garments are produces under legal, humane and ethical conditions across the world.
Today, WRAP is sponsored and endorsed by a growing list of brands and Export Associations. Acceptance of the WRAP Program eliminates the costly duplication of monitoring on behalf of different corporations. E.g. Russell’s Corporation, Sarah Lee, Jockey.
The Principles of WRAP
Three Level Certification
On October 2006, WRAP further introduced a new, three-level factory certification program. The purpose of this program is to award participating factories with the appropriate level of recognition for their progress in achieving full compliance with the WRAP Production Principles over a period of time. The details are as follows:
“A” Level Certificate – awarded to a factory that has demonstrated full compliance with all WRAP principles for three consecutive years, and has successfully “passed” each audit with no corrective actions. Factories that meet these criteria will be issued a two-year certificate.
“B” Level Certificate – A one-year certificate is awarded to a factory that has demonstrated full compliance with all WRAP principles during the first audit, or in subsequent audits.
“C” Level Certificate – A six-month certificate will be issued to factories that demonstrate substantial compliance with the WRAP principles, but have minor non-compliances in policies, procedures or training that need to be addressed.
For details and to download WRAP Certification Handbooks and Self Assessment Forms, please visit www.wrapapparel.org
In 2000, Malaysian textile-manufacturing establishments numbered 530, as reported in the 2005 ASEAN Statistical Yearbook. There were 2,682 facilities in Malaysia that produced apparel or dressed and dyeing. According to a 2003 report from the US International Trade Commission entitled “Textiles and Apparel: Assessment of the Competitiveness of Certain Foreign Suppliers to the US Market,” the Malaysian industry comprised 237 mostly small and medium-sized firms in 2000. MIDA reports that as of July 2005, there were about 900 companies in production, employing more than 68,000 workers.According to MITI, the textile and apparel industry employed 66,506 people last year, a 3.9-percent decrease from 2004, in a country with an estimated July 2006 population of 24.4 million people and a labor force of approximately 10.7 million. MITI attributed the employment decline to greater production automation and increased focus on producing high-value-added products.
The industry’s 2005 productivity was up 8.1 percent from 2004 for a sales value per employee of $34,644, mainly the result of high demand in the man-made-fiber spinning and apparel subsectors. The textiles sector recorded a 4.8-percent decline in sales value per employee to $55,839, which was attributed to competition from countries with lower production costs. Sales value per employee in the apparel sector, on the other hand, grew by 10.6 percent to $21,829, a rise resulting from the development of fashion and design niche markets and more demand for apparel manufacturing, accessories, and merchandising.
According to the Switzerland-based International Textile Manufacturers Federation’s (ITMF) 2005 edition of its International Textile Machinery Shipment Statistics report, Malaysia’s spinning capacities for 2004 numbered 650,000 short-staple spindles, 35,000 long-staple spindles and 6,000 open-end rotors. Those capacities were the same in 2003. The country’s weaving capacities in 2004 were 4,000 shuttleless looms and 1,200 shuttle looms, also identical to the 2003 reported numbers.
There were no reported 2005 shipments for short-staple, long-staple and false-twist spindles, nor for open-end rotors and flat-knitting machines. However, cumulative texturing shipments from 1996 to 2005 numbered 4,968 for double-heater false-twist spindles. Two rapier/projectile, 132 air-jet and zero water-jet made up the reported 2005 shipments of shuttleless looms. Textile machinery manufacturers shipped a total of 4,165 shuttleless looms and 27 shuttle looms from 1996 to 2005. Shipments in 2005 of circular-knitting machines with working widths greater than 165 millimeters totaled 60. ITMF reports that in 2005, Malaysia invested in very few finishing machines, a category that was included in its annual report that year for the first time.
2005 German Textile Machinery Exports to Malaysia (thousands of euros )
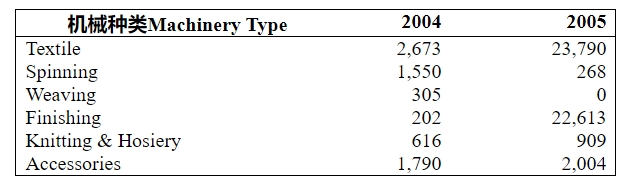
The government implemented the quotas in a bid to resuscitate South Africa’s clothing manufacturers, which had been hard hit by cheaper Chinese imports.
Fashion retailer Foschini said it had raised imports from the Far East except China after the implementation of quotas. Financial director Ronnie Stein said the company had increased imports from countries such as Bangladesh and Vietnam and had started sourcing more items in South Africa. But he added that prior to the quotas, Chinese imports made up 1 million garments out of 30 million sold by the retailer each year.
Len Smart, the executive director of the Natal Clothing Manufacturers’ Association, pointed out that the restraints were on 30 percent of imports from China. “A lot of my members will probably turn to Botswana, Lesotho, Namibia and Swaziland to buy garments or will put their own factories there. Others have spent the last three months frantically visiting other low-cost producing countries.”
The market value of apparel sales in Saudi Arabia was estimated at SR8.55 billion (US$2.28 billion) in 2005. Almost 27% or SR2.29 billion (US$ 0.61 billion) of these sales were contributed by branded apparels.
As the Saudi people enjoy higher disposable incomes and become more fashion-conscious there is a shift towards buying more branded apparels. The trend is further boosted by the expansion of the number of shopping outlets and international retail chains. Malaysian companies producing ready-made garments and apparels should explore further the potentials in the Saudi apparel market. Malaysian companies can penetrate the market through establishing their own retail outlets, selling branded garments or franchising the retail concept to locals.
One potential segment in Saudi Arabia is in women and children’s clothing. Women’s clothing is the largest retail sector, accounting for 54% of the apparel sales and is considered the most mature segment of fashion retail in Saudi Arabia. Children’s clothing is the third largest segment after footwear. There is also an emerging opportunity in menswear, especially in young men’s clothing and accessories, including sportswear and eyewear.
In order to succeed in the market, Malaysian companies should be able to produce apparels, which are fashionable, competitively priced and carry authentic brands. Branding the apparel effectively is important, to prevent it being perceived as a low-end product or just copies of other international brands. For more information on this market, contact MATRADE’s office in Jeddah.
Canada : Significant Global Importer of Apparel
Canada’s robust retail market continued strong in November 2006, with total sales increasing 4.7 percent. Apparel retail sales reached 1.419 billion Canadian dollars, which was down from 1.459 billion Canadian dollars in October but reflected 4.5 percent year-on-year growth.
November 2006 sales growth in apparel was the slowest since July, which may suggest the robust activity of the last few months is slowing. Year-to-date apparel retail sales totaled 15.744 billion Canadian dollars, reflecting 6.3 percent year-on-year growth. Canada’s apparel retail sales have advanced for four consecutive years, making the country a significant global importer of apparel.
Ireland: Apparel Retail Sales Continue to Lead Old Europe
Ireland, the “tiger” of Europe, is continuing to lead Old Europe in the growth of apparel retail sales. In November 2006, retail sales of apparel and footwear reached an all-time record for a month other than December.
Retail sales also increased 13.4 percent from year-ago levels and represented the strongest month-on-month growth in two years. Apparel retail sales have expanded in 23 out of the past 24 months.
Baltic : Red Hot In Textile and Apparel Retail Sales
The Baltic region of Europe remains red hot in the area of textile and apparel retail sales. Retail sales of textiles, apparel, footwear and leather goods reached an all-time monthly record in November and also reflected 62.5 percent year-on-year growth. This marked the 23rd consecutive month of strong year-on-year growth.
In Latvia, November retail sales of textiles and apparel did not reach a record but posted 44.6 percent year-on-year growth, and its 2006 monthly retail sales of apparel doubled its growth rate from the previous year. In Lithuania, retail sales of textiles, apparel, footwear and leather goods surged 31.1 percent in November, which marked the sixth consecutive month of 30 percent or more growth.
Latin America : Phenomenal Growth in Textile and Apparel Retail Sales
Latin America has been overlooked in the global growth story of 2006. Phenomenal growth in textile and apparel retail sales was evident across several of the countries in the region. In Venezuela, record oil revenue has unleashed a spending spree that has clearly benefited the country’s retail sector.
Venezuela’s retail sales of textiles, apparel, shoes and leather experienced 66.2 percent year-on-year growth in September, pushing sales volume to an all-time record for the month. Total retail offtake of textiles and apparel in September 2006 was over three times the volume of September 2003; and since March, retail sales have grown from 25 percent year-to-year to 77.1 percent. Monthly sales have expanded for three consecutive years.
This prosperity is benefiting the country’s small textile and apparel sector. In December, Venezuela placed an import duty ranging from 15 to 35 percent on some apparel items, along with furniture and other products. The duty is designed to boost the consumption of Venezuelan-made products. Domestic textile production averaged a 3.3 percent year-on-year monthly increase in output during the January through September time period, while apparel production experienced a 3.9 percent average monthly expansion. Output in both sectors remains substantially behind the level of production that occurred in 1997/98. Much of the industry is focused on man-made fiber products. Annual cotton consumption appears to be near 40,000 to 50,000 bales.
Colombia’s retail sales are also booming. October total retail sales experienced 17.3 percent year-on-year growth, and year-to-date sales are up 14 percent. Domestic consumer confidence is expanding, along with a drop in unemployment; this along with wage growth is boosting sales.
Apparel retail sales increased 15.9 percent in October, marking the 34th consecutive month of growth, and year-to-date sales are up 12.9 percent. Textile retail sales soared 23.7 percent in October, and year-to-date sales are up 8.2 percent. This growth has been a major boost to Colombia’s textile and apparel sector.
US Apparel Retailers Post Disappointing Sales for December
Wal-Mart, the king of retailers, reported a gain of 1.6 percent in sales from stores open at least a year. Target, Wal-Mart’s chief competitor, had a much better month as same store sales rose 4.1 percent. Other mass merchants had relatively flat month with the sole exception of Costco, which reported a 9 percent gain in same store sales.
The nation’s largest retailing chain, Gap Inc., reported another dismal month as same store sales decreased 8 percent. Its lower priced apparel chain, Old Navy, fared no better, posting a drop of 10 percent in same store sales.
In the youth apparel market, American Eagle continued its impressive run, as same store sales hit 13 percent. Abercrombie & Fitch, posted its third consecutive losing month with same stores sales decreasing 0.1 percent.
Women’s apparel retailers posted a mixed month as Cache, Cato and the Dress Barn all reported positive numbers while Cato and Chico each reported decreasing same store sales.
The children’s apparel channel was dominated by Gymboree’s double-digit gain of 15 percent versus a year ago. The Children’s Palace reported a 5 percent gain in same store sales.
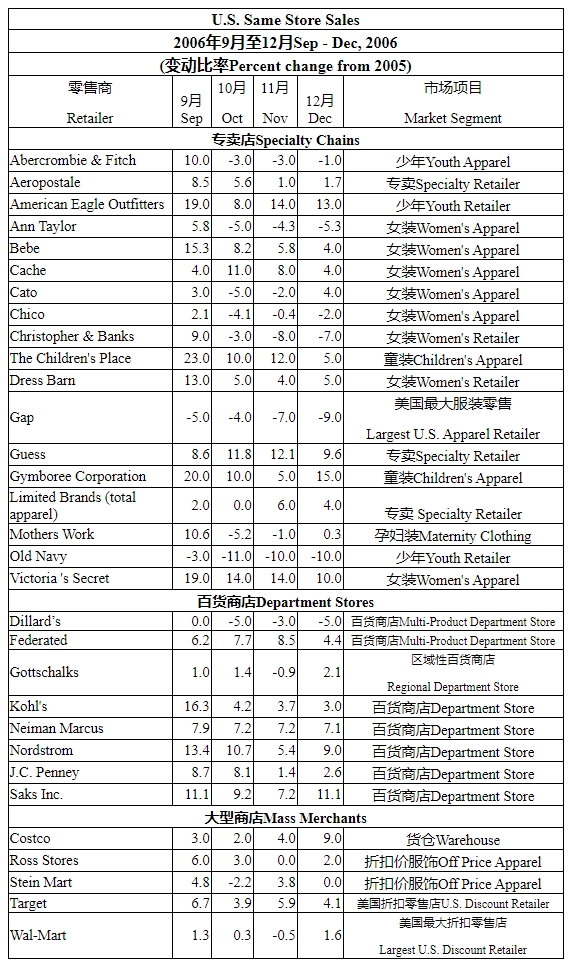
Cotton fabric imports in December were very weak at 146 million meters, which represented an 11.59 percent year-on-year decline. Total 2006 cotton fabric imports reached 1.488 billion square meters, reflecting a 4.19 percent year-on-year decline.
The local government has begun to regulate the quality of apparel through spot quality checks — earlier in the year, several major quality issues were raised in children’s apparel products by these spot checks.
The inspections were carried out at several of the major malls in the Shanghai. Apparel products of 17 international brands failed the quality inspection, which was linked mostly to chemicals used in processing the garments. Some contained too much formaldehyde, which is sprayed on the garments to reduce mildew during shipping. The inspection also centered on the garments’ makeup compared with what was displayed on the label — an example of this was a European brand cashmere-blend was labeled as 20 percent cashmere when it was only 1.7 percent.
Similar tests of local brands revealed many problems earlier this year. These changes most illustrate the coming of age of the Chinese domestic market and the quality demand this involves. China is the fastest growing market in the world for luxury brands.
Financial Aid from the Government
In order to transform quantity-based into quality-based economy, Government of Shishi city allocated RMB3 million to provide technical support in textile, garment and shoes industry.
There are total 24 units to accept the first technical support, including six units from textile and dyeing trade, three shoes units, two textile machine units, two garment units, two chemical units.
The highest amount of fund is RMB250,000, the lowest support is RMB50,000.
In addition, the support fund of the Government will gradually focus the high and new technical industry. There are six high and new projects in the first batch.
The European Union Parliament passed the REACH chemicals legislation on 13 December 2006 and is scheduled to take effect from June 2007. The chemical substances in question are to be tested and registered with the future European Chemicals Agency located in Helsinki, Finland.
REACH requires industry to register all existing and future substances and chemicals, collecting data for chemical, toxicological and environmental-impact properties. The EU REACH regulation replaces 40 EU directives for chemical control regulations, placing all chemicals into a unified regulatory system.
REACH aims to overhaul the way that chemical substances are managed within the European Community. Standing for Registration, Evaluation and Authorisation of Chemicals, REACH will continue the trend of making industry responsible for its products by shifting the responsibility for testing and risk assessment from public authorities to manufacturers and importers of chemicals.
Thousands of chemical substances will be reviewed under the REACH legislation.
The purpose of this Regulation is to ensure a high level of protection of human health and the environment as well as the free circulation of substances on the internal market while enhancing competitiveness and innovation. The ultimate aims of REACH are to compile data on the many thousands of substances for which there is currently little or no data currently available; centralise the data-storage and management of these substances in a new European Chemicals Agency; and encourage the substitution of the most harmful substances by imposing on them restrictions or authorisation conditions.
Scope
REACH is very wide in scope and covers almost all manufactured or imported substances that are put on the market or used as intermediates.
Every single company using chemicals anywhere in the European Union will be affected in some way. Whether you’re a chemicals producer, a manufacturer or an importer, the chemicals you produce or use will have to be registered as an approved substance.
Registration
Registration requires that companies submit specified data on the chemicals that they manufacture or import to the Chemicals Agency in Helsinki. This data will be used to ensure that each substance is managed appropriately, and that any risk to human health or the environment is controlled effectively.
Under REACH, data sharing is encouraged to reduce testing costs and required to minimise testing on animals.
The 2007 Customs Tariff is scheduled to undergo major changes worldwide as a result of modifications to the Harmonized System (HS) recommended by the World Customs Organization (WCO). All importers and exporters should take measures to ensure the transition between the old edition and the new revisions is a smooth one.
The Harmonized Commodity Description and Coding System, better known as the Harmonized System or the HS, is developed by the World Customs Organization (WCO).
The HS can rightly be called the “language of international trade” as it also lends itself to many other uses, for example in areas of trade policy, rules of origin, the monitoring of controlled goods, internal taxation, transport tariffs, statistics, quota controls and economic studies and analyses.
It is a unique trade facilitation instrument which ensures the application of Customs rules and is used and applied by both the public and the private sectors to identify and code of goods in international trade. More than 200 countries and economic or Customs unions around the world use the Customs Tariff based on the HS to regulate approximately 98% of all goods traded globally.
What ’s New in the 2007 Version?
The 2007 version is the third major revision of the HS since its adoption by the WCO Council in 1983 and its entry into force in 1988. They were adopted in order to:
The 2007 changes are much more wide ranging and, as a result, will affect many more importers and exporters. Consider the following factoids:
All of the free trade agreement rules will need to be amended to reflect the changes in classification.
The changes to the HS will primarily affect industrial and products including textiles. The changes are not limited to numeric classifications only; there are Section and Chapter Note changes as well.
US HTS Implementation
The U.S. versions of the Harmonized Convention undergo minor changes each year. The U.S. International Trade Commission (ITC) regularly updates the import Harmonized Tariff System Annotated (HTSA) at least twice each year. Generally, modest changes are implemented to the nomenclature of the tariff and to duty rates each January while technical adjustment to free trade agreements and duty preference programs occur each spring.
The 2007 updated HTS will be in effect on February 3, 2007 in US. There will be a grace period which begin on February 3, 2007 and end at close of business February 20, 2007. Entries filed on or after February 21, 2007 will be made with the appropriate WCO HTSUS changes.
Impact on Companies
The initial impact upon companies will be the administrative burden of updating your classification databases, don’t forget your legal obligation to properly classify your imported and exported products. Fines and penalties for incorrect classifications are levied upon the importer and the exporter and rarely upon the broker or forwarder.
The ITC has published an excellent document on its website detailing the changes to take effect in 2007. Within this report you will find the list of the eight-digit classifications, which will be changing.
The following websites are useful:
Rebounding November
Malaysia’s textile and apparel sector experienced a rebound in both production and output in November 2006. This was accompanied by a surge in exports, with total textile, apparel and footwear exports reaching RM930.7 million, which was the highest level since August and represented a 22 percent year-on-year increase.
Total January through November cumulative exports expanded 7.5 percent to RM10.268 billion. The top export market was the U.S., with January through November exports to the U.S. increasing 14.6 percent to 347.48 million square meters.
Monthly apparel output has been very strong in recent months, expanding 39.9 percent in September, 17.4 percent in October and 14.6 percent in November. November output reached 7.505 million units, which was the second highest output of the year. January through November cumulative apparel output expanded 35.7 percent to 76.91 million units, while textile output experienced a more limited recovery.
Slowed in September
Malaysia’s boom in textile and apparel exports dramatically slowed in September through October, but remained strong year-to-date. September exports of textiles, apparel and footwear declined 6 percent from the previous year to RM913.9 million and were followed by a 20.6 percent decrease to RM781.3 million in October. October shipments were somewhat influenced by a reduction in the number of working days during the month due to the Islamic Eid Holiday and Hindu Deepavali Festival
January through October cumulative exports reached RM9.356 billion (2.663 billion U.S. dollars), representing a 6.5 percent year-on-year increase. The U.S. remained one of the top markets, with exports through October up 17.6 percent. Cotton apparel and man-made fiber non-apparel products were the strongest export products.
Textile and apparel production significantly increased in the January through July time period. The slowdown in exports led to a downturn both in September and October, with September production falling 2.3 percent and October declining 8.5 percent. October total output was the lowest since February, and the weakest sector has been cotton textiles.
Cotton fabric output
Cotton fabric output has turned very weak in recent months — October output plunged 18 percent below year-ago levels at 13.122 million square meters. Year-to-date output has declined 4.2 percent. In contrast, domestic output of apparel has continued strong, up 17.4 percent in October and up 38.5 percent year-to-date. Strong domestic demand has been evident, influenced by robust economic growth.
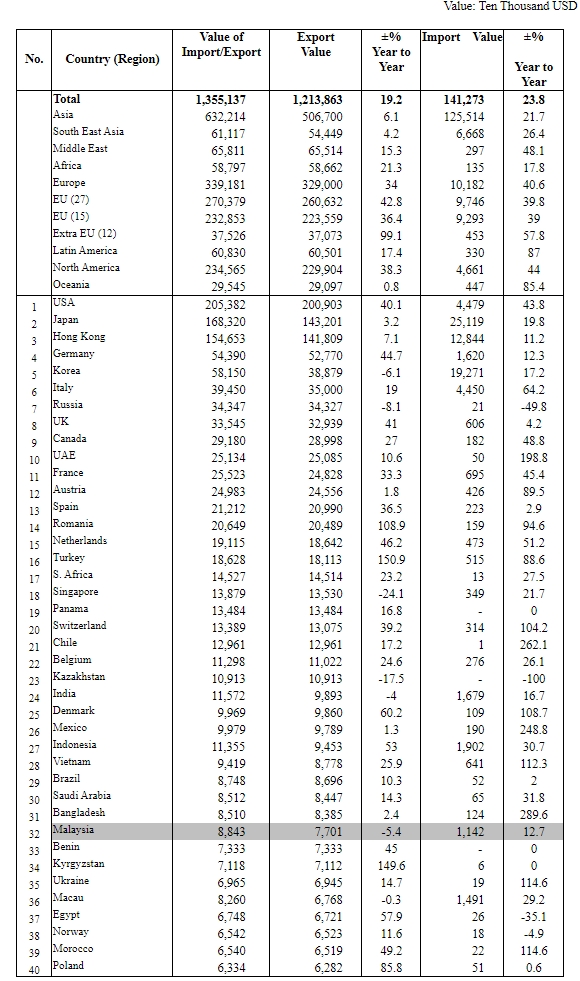
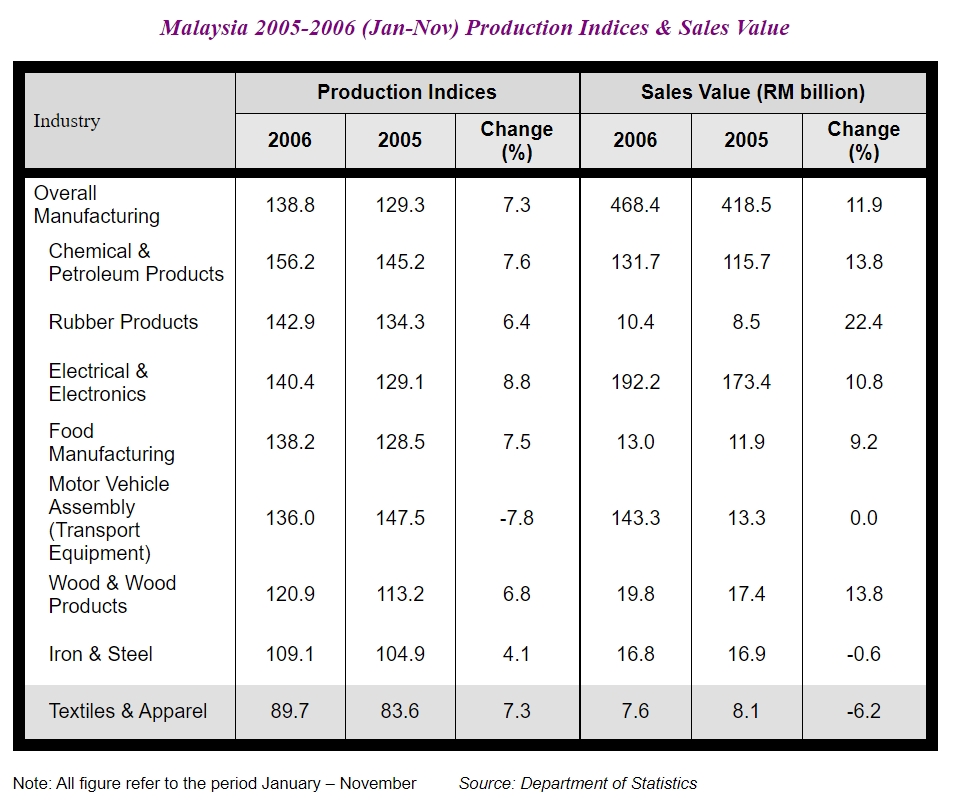
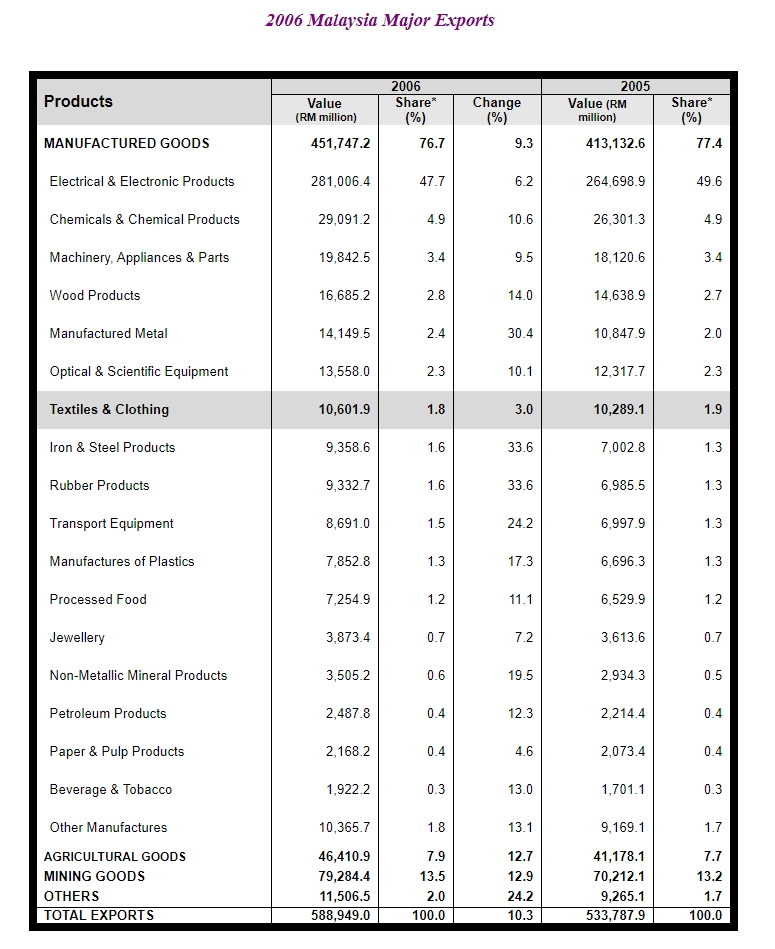
For much of the 2000 – 2005 time frame, global apparel prices steadily eroded regardless of the fluctuation in raw material prices. The main driver behind the price erosion was the ability of global retailers to negotiate a cut in the wholesale price of apparel from Chinese suppliers. They would, in turn, use this negotiation to force other suppliers to match the Chinese price if they wanted to keep their business. In the U.S., this tactic was used by Wal-Mart to steadily reduce the selling price of all its textile and apparel products. Under these conditions, most of the leading U.S. brands outsourced all manufacturing either to China or one of its competitors, which led to the total collapse of the traditional U.S. textile and apparel firms.
Development of the “China Price”
This annual procedure of price-cutting not only occurred in textiles and apparel but also in toys and most other manufacturing items. These yearly negotiations led to the development of the “China Price”. It was not until mid-2005 that the Chinese exporter finally was not able to cut prices any longer. In late 2004 and early 2005 Chinese exporters were forced to absorb increased costs themselves. In addition, China’s domestic textile market had evolved into a much freer market, leaving manufacturers clearly exposed to fluctuating fiber costs. Amid these conditions, Chinese exporters were forced to tell sourcing companies “no” in regard to further price cuts. Even the largest U.S. retailers faced an inability to obtain lower prices.
Rising Production Cost in China
As China’s manufacturing and labor costs have risen, Chinese exporters have been heavily investing in modern equipment and establishing entire manufacturing cities, which allow the retailer ease in sourcing and a quick turnaround in both shipping and design. This transformation has caused Chinese exporters to shift the lowest value-added products to cheaper labor markets such as Bangladesh, Vietnam, Cambodia, Pakistan and others. Amid these conditions and a move to more upscale valued-added products, China’s average domestic and export price of textiles and apparel are rising. The “China Price” has ended, and with it has come some re-inflation of the supply chain, which has significantly improved the profit margins of the entire global industry.
Chinese Domestic Market
In regard to the domestic market, Chinese retail sales of textiles and apparel have been growing at an annual rate of over 20 percent for several years. For much of the 2000 – 2004 time period, the rapid rise in domestic textile and apparel manufacturing led to an oversupply of products available for the domestic market. With consumer brand identification low, manufacturers attempted to gain market share by only one way and that was to cut the price in a host of products. By the end of 2005, domestic retail prices of all products had fallen over 2 or more percent during the year. Apparel price declines matched this drop.
Brand recognition in China is rapidly expanding, but apparel sales remain driven on price considerations. The change in 2005 to focus on the domestic market instead of exports led to very aggressive price-cutting. In the first half of 2006, average retail apparel prices suffered an over 2.5 percent year-on-year decline for a few months, but pricing conditions have generally been improving since then.
In November 2006, retail sales of textile producers rose 0.3 percent from October and 0.9 percent from a year ago. Apparel prices rose 0.5 percent from October and experienced a 0.2 percent year-on-year increase. This brings the most prolonged period of price deflation in retail prices experienced in modern China to an end. The ability to increase prices also has major ramifications for the profitability of the country’s textiles and apparel sector.
Increase in Prices The increase in prices has continued, with February 2007 apparel retail sales expanding .5 percent from the previous year. This minor price inflation has significantly improved profit margins. These conditions have also coincided with a government effort to force manufacturers to improve the quality of apparel at the retail level and to honor trademarks and copyrights of local brands.
The increase in the average export price for textiles and apparel has even been more pronounced. Total textile and apparel exports reached US$147.085 billion in 2006, which represented a 25.11 percent year-on-year increase. A significant portion of this increase came from a sharp rise in the average export price. China’s Customs Department has now confirmed that the average export price of textile and apparel products increased 10.14 percent in 2006.
January import statistics for the U.S. and Japan suggest that prices have further increased in 2007. In January, the quantity of U.S. textile and apparel imports from China rose 23.3 percent; however, in value terms, imports surged 54.8 percent from a year ago. In cotton apparel, the average increase in import price was even stronger.
In Japan, the average 2006 import price of cotton yarn rose 18.5 percent in yen terms, and cotton fabric prices increased 14.4 percent. An increase in the average price of imported apparel ranged from 4.9 percent in men and boy’s apparel to 8 percent in hosiery and baby apparel.
A healthy textile and apparel sector is emerging worldwide following an end of the “China Price”.
Japan imported 2.752 trillion yen worth of apparel in 2006 or approximately US$22.743 billion, which represented an 11.5 percent year-on-year increase. 82 percent of all imports or 2.256 trillion yen worth came from China. This represented a record share for China. The import growth came, in part, from a surge in the average market prices of all products. The average per unit price increase ranged from 4.1 percent up to 8 percent from year-ago levels in yen terms.When measured in volume terms, the growth was much slower and averaged from 1 percent up to 6.8 percent.
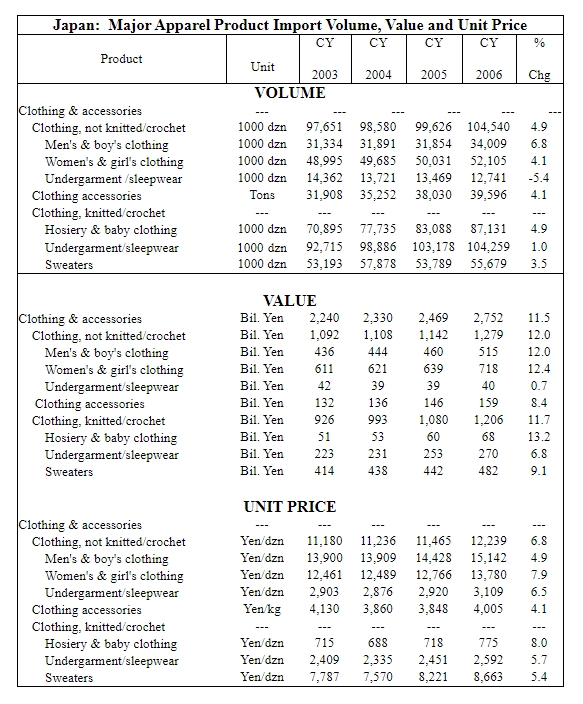
Indonesia exported a record US$3.911 billion worth of textiles and apparel to the U.S. in 2006. This represented a 26.62 percent year-on-year growth; and in volume terms, an export expansion of 18.1 percent.Apparel exports accounted for US$3.670 billion of the export total. Exports grew across most major categories, except fabrics and made-ups. Cotton apparel exports expanded 34.36 percent to US$2.076 billion. The growth in cotton apparel exports was led by a surge in shipments of women and girl’s cotton slacks, knit blouses and men and boy’s cotton trousers, cotton underwear and knit shirts.
It appears that Indonesia’s exports in the made-up sector were relinquished to Pakistan and India, with cotton made-up exports falling 25.8 percent in volume terms. Indonesia has proven to be very competitive in cotton apparel products. Indonesia was the fourth largest supplier of women and girl’s cotton trousers to the U.S. market in 2006 and successfully beat out Bangladesh, a major competitor, as well as Vietnam. Indonesia’s exports of men and boy’s cotton trousers surged 50.8 percent in 2006 to US$201.5, (million ?) making it the seventh largest supplier.
The textiles and textile products industry comprises of four sub-sectors, namely primary textiles which cover activities such as polymerisation, spinning, weaving, knitting and wet processing; made-up garments; made-up textiles; and textile accessories.
Currently, there are 646 licensed companies in operation with investments of RM8.1 billion, of which:
The textiles industry continues to make significant contributions to exports and employment. In 2006 (January-November), the textiles and textile products industry was the seventh largest export earner, contributing RM9.7 billion or approximately two per cent of total exports of manufactured goods. In 2005, exports of textiles and textile products amounted to RM10.3 billion. The abolishment of textile quotas in January 2005 and the imposition of textile quotas by USA on China in July 2005, created opportunities for the Malaysian textiles industry to increase their exports globally.
Malaysia’s textile and apparel exports enjoyed a period of growth in 2006, with total exports reaching RM11.205 billion. This was the highest total in over five years and reflected 6.5 percent growth.
Malaysia has proven successful in the post-2005 world despite its disadvantages. In 2006, Malaysia was able to increase exports to the U.S. market by 9.8 percent in volume terms and 1.9 percent in value terms, reaching US$739.36 million — 66 percent of all exports were apparel.
Total textile and apparel production has also increased in 2006, posting 5.9 percent year-on-year growth; however, textile output actually weakened, while domestic apparel production soared 21.3 percent to the highest level in over five years of 85.125 million units.
Indonesia exported US$3.67 billion worth of apparel to the U.S. market in 2006, which was a 5.29 percent market share of all apparel imports, making it the third largest apparel supplier to the U.S., only falling behind China and Mexico. Exports have further increased in first quarter 2007, placing Indonesia in a position to replace Mexico in 2007 and move into position as second largest supplier.
Indonesia has been very successful in competing with China in the U.S. market, especially in man-made fiber apparel. During first quarter 2007, Indonesia exported US$363.25 million worth of man-made apparel to the U.S. market, which represented 26.09 percent year-on-year growth and made it the second largest supplier to the U.S. market, replacing Mexico for the first time in 2007. Exporters have increased shipments at nearly twice the rate of growth in total U.S. imports. The country has not only taken market share from Mexico but also Taiwan, Canada and South Korea.
U.S. cotton apparel imports from Indonesia during first quarter 2007 increased 18.04 percent, reaching US$616.187 million, making it the fifth largest supplier only falling behind China, Mexico, India and Bangladesh. The success in the U.S. market is drawing new foreign investment in the sector. 2006 FDI in textiles and apparel is estimated at over 400 million U.S. dollars, which is more than five times the level of 2005.
Indonesia Releases Textile Aid Funds
A block of 255 billion rupiah or approximately US$28.02 billion of government aid is now available to Indonesian textile mills for the purchase of new upgraded machinery that was manufactured after 2005.
The fund allocation is 20 percent to yarn spinners, 50 percent to weavers and 30 percent to apparel manufacturers and will be paid directly to firms after they have purchased the new equipment. Each approved mill is expected to have a maximum of 11 percent of their total upgrade costs covered by government aid. 175 billion rupees of this aid will go to pay interest costs on private loans secured for the upgrade, and 80 billion will be designated as soft loans for the equipment purchase.
In recent years, Brazil has had a significant increase in apparel imports, with imports sharply expanding in 2006 as strength in the real/U.S. dollar exchange rate continued to impact trade. The new import duties are aimed at slowing imports from China, India, Pakistan and Bangladesh.
Sale or import of products that do not comply with these rules is prohibited, even if the commodity is manufactured in South Africa.
Government was compelled to take this step after inquiries showed, large amounts of products with no or misleading country of origin labels being sold and imported.
DTI, South African Revenue Services (SARS) and the South African Bureau of Standards will make sure that the rules are strictly being followed. SARS will perform routine inspections and any contraventions will face a fine of up to R5,000 (RM2,400) or up to three years in jail.
Export Composition of Textiles and Clothing
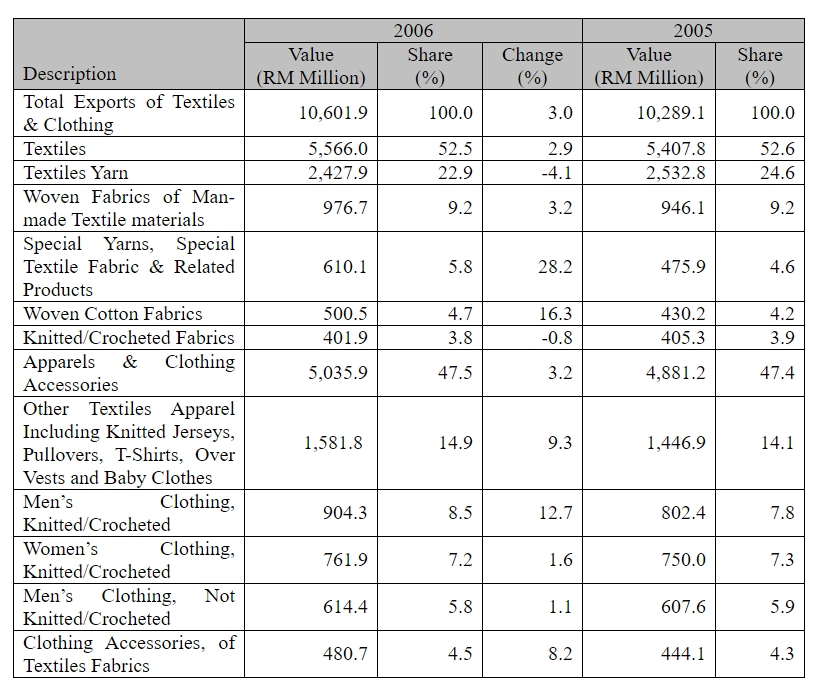
Exports
· Exports of textiles and clothing registered a growth of 3 per cent to RM10.6 billion in 2006 from RM10.29 billion in 2005. This sub-sector accounted for 1.8 per cent of Malaysia’s exports of manufactured goods.
· Within this sub-sector, textiles contributed 52.5 per cent to total exports, while apparels and clothing accessories accounted for 47.5 per cent.
· The main export items under textiles were:
– textile yarn, valued at RM2.43 billion, with a 23 per cent share;
– woven fabrics of man-made textile materials, RM976.7 million, 9.2 %;
– pecial yarns & textile fabrics and related products, RM610.1 million, 5.8 per cent;
– woven cotton fabrics, RM500.5 million, 4.7 per cent;
– knitted and crocheted fabrics, RM401.9 million, 3.8 per cent.
· Major exports of apparels and clothing accessories were:
– textile apparel including knitted jerseys, pullovers, tee-shirts, over vests
and baby clothes, valued at RM1.58 billion, with 15 per cent share;
– men’s clothing, not knitted or crocheted, RM904.3 million, 8.5 per cent;
– women’s clothing, knitted and crocheted, RM761.9 million, 7.2 per cent.
· The top five export destinations for textiles and clothing were the USA, Turkey, Japan, Singapore and the PRC.
· Exports to the USA, which accounted for 27.6 per cent of Malaysia’s total exports of textiles and clothing,had registered a marginal decline of 0.2 per cent. This was due mainly to lower exports of textile yarn, man-made fibers and men’s clothing, knitted or crocheted.
· Exports to Turkey increased by 3.9 per cent, accounting for 6.3 per cent share. Main export item was textile yarn, which increased by 85.2 per cent to RM662.7 million.
· Markets that recorded significant export growth were:
– Italy, valued at RM255.1 million, an increase of 16.2 per cent;
– Spain, RM194.4 million, 42.9 per cent;
– France, RM185.9 million, 17.7 per cent;
– Mexico, RM154.9 million, 78.5 per cent;
· As a source of imports in major markets, Malaysia’s position in:
– The USA, 26th largest supplier with a 0.8 per cent share;
– Turkey, 8th , 3.6 per cent;
– Japan, 13th , 0.5 per cent;
– Singapore, 2nd , 14 per cent;
– The PRC, 14th , 0.7 per cent.
Major Export Destinations for Textiles and Clothing
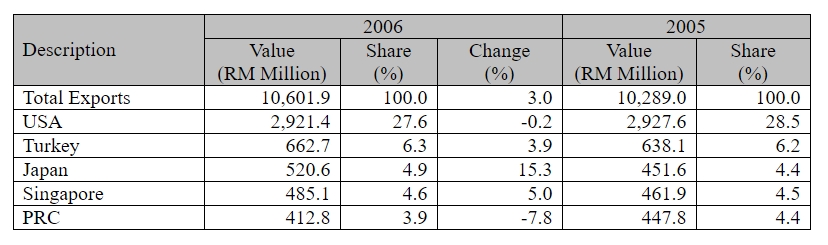
Imports
· Total imports of textiles and clothing increased by 8.2 per cent to RM5.44 billion from RM5.03 billion in 2005, due largely to higher imports of textile yarn, valued at RM958.2 million.
· The main composition of textiles and clothing imports were textile yarn, with a share of 17.6 per cent, woven fabrics of man-made textile materials(12.5 per cent) and knitted and crocheted fabrics (11.9 per cent).
· In 2006, major sources of imports of textiles and clothing were:
– the PRC, with a value of RM1.88 billion (34.5 per cent of total imports). Main import items were woven fabrics of man-made textile materials, with a share of 13.4 per cent, knitted or crocheted fabrics (13.4 per cent) and other textile apparels (11.4 per cent);
– Taiwan, RM555.8 million, 10.2 per cent;
– Indonesia, RM473.7 million, 8.7 per cent;
– Thailand, RM418.2 million, 7.7 per cent;
– Japan, RM332.7 million, 6.1 per cent
Malaysia’s export growth in textiles and apparel has suffered as the Ringgit has appreciated against the U.S. dollar. The Ringgit has appreciated approximately 3.9 percent against the U.S. dollar in 2007 through the end of May.Cumulative January through March textile, apparel and footwear exports reached RM2.4047 billion or US$708.2 million. Exports to the U.S. in the January through March period totaled US$173.64 million.
Total textile and apparel production has fallen as a result. January output declined 9.9 percent from year-ago levels. This was followed by an 11.9 percent decline in February and 9.6 percent decline in March. Total output in the first quarter of 2007 declined 15.2 percent from the average monthly output experienced in 2006. The most significant weakness has occurred in the textile sector.
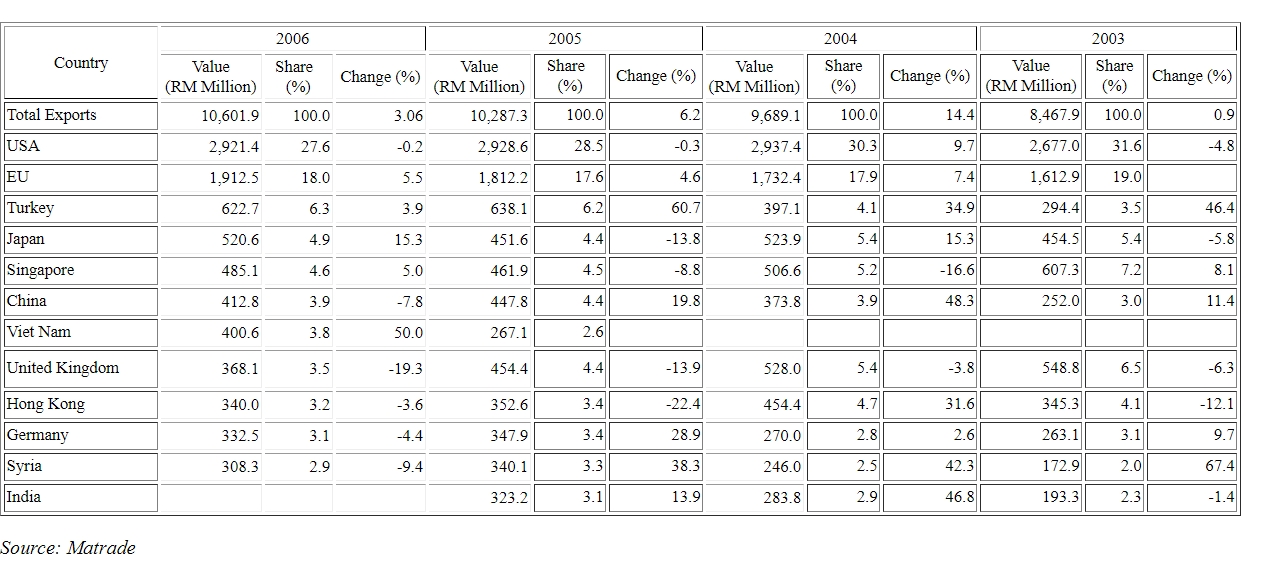
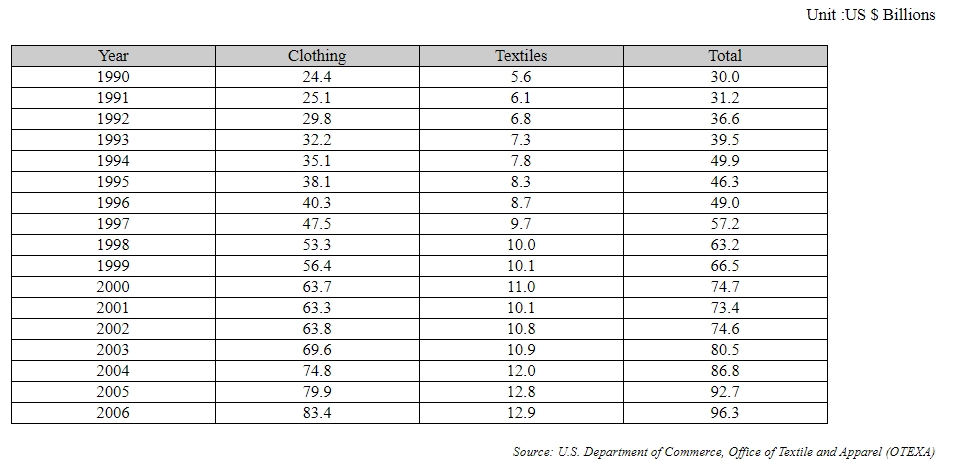
Between 1990 and 2006, U.S. clothing imports rose by $59.0 billion, or an average annual growth rate of 14.2%. Textile imports, by contrast, increase by $7.3 billion, or an average annual growth rate of 7.6%.
The apparel industry needs to transform itself, from mere production to a knowledge based industry. It was earlier just ‘something to wear’ but today the global consumers and global markets have evolved.
Levis recently launched 100% organic cotton jeans. Where they say the cotton is organic the button on the waste band is organic because it is made out of a coconut shell, the label is from recycled card board, the dye is from natural compounds and no metal rivets are involved in the whole product.
Now this is because of an emerging trend where there is concern for the planet, concern for sustainability of our environment, which is becoming fashionable, and the need of global consumers and the global market.
So this has actually required businesses, vendors, service providers etc to adapt; to align themselves to the global marketing requirements.
Similarly, Dockers have also launched a new range of golf pants where they say there is ultra violet protection, that it is wrinkle free, it has effects that make you feel cool when you are on a long day of golf and there is anti microbio technology.
Some of the new trends that are emerging are functional and intelligent fabrics, self lean fabrics, stain and static resisted coating, impact resistance clothing, memory shaped foams that helps a particular body shape or accommodates a particular body shape which is sewed in that entire foam through the use of memory.
Intelligent fabrics which will resemble that the next time the user uses it and face change fabrics that can actually regulate body temperature in military applications for strategic communication purposes, embedding Global Positioning Systems in clothing that will help communicate certain advanced communication requirements to remote medical teams etc.
In the medical applications heart sensing sports bras that have come in to the market, electro cardiogram recording shirts and vitamin induced wearable fabrics that allow the body to absorb nutrition over a period are some of the aspects of innovation that is actually sweeping through the landscape of the global apparel industry.
So as a supplier to the global apparel industry are we going to stand and watch as these things take place and build for ourselves a solid knowledge platform that integrates all these aspects of the global business landscape in the apparel industry.
So today, there are new dimensions that the customers require from us. They want us to have marketing competencies; they need us to offer solutions to them. They need us to be brilliant manufacturers’ not good manufacturers, lean in our systems processes and very cost effective, cost conscious and giving them best value for their money.
Definition of SMEs
Companies with annual sales turnover not exceeding RM25 million OR full time employees not exceeding 150.
Qualifying Criteria
Qualifying criteria for enterprises in the manufacturing sector registered under business ordinance 1956 are eligible to apply the following grants up to 80 percent of the approved costs :
Ø Matching Grant for Business Start ups
Ø Matching Grant for Enhancing Product Packaging
Ø Grant for Enhancing Marketing Skills of SMEs
Ø Grant for Skills Upgrading
* This flexibility is only for a period of 3 years until May 2009. These enterprises are expected to upgrade their companies to Sdn. Bhd. in order to continue receive of financial assistance.
MATCHING GRANTS
Matching Grant for Business Start-ups
– Preparation of Business Planning
– Related Feasibility Studies
– Rental of equipment and machineries
– Development of prototype
– Product sample and testing
– Rental of incubators and business premises up to 24 months
Matching Grant for Product and Process Improvement
– Technology Feasibility Studies
– Fees for technology transfer (e.g. technical licensing/ disclosure / agreement/
acquisition and blueprint/ drawing)
– Development of prototypes and system design
– Product testing
– Product registration
– Marking and labelling (e.g. Bar-coding)
– Machine & equipment testing and calibration
– Development & designing of equipment and machinery (including jigs,
moulds and dies as well as ICT-related activities)
– Purchase of machinery and equipment subject to maximum matching grant
RM100,000 per application
– Initial patent registration/patent search/ IP Protection
– Specific Project Mission (e.g. Mould & Die)
– Cleaner Production & Waste Treatment Project including Energy Efficiency
Audit
Matching Grant for Certification and Quality Management Systems
– Product certification
– Hazard Analysis Critical Control Point (HACCP)
– TS 16949
– Quality Improvement Practice e.g. 5S, Six-Sigma and Productivity Audit
– Good Manufacturing Practice (GMP)
– Occupational, safety and health management system (OSHA)
– Restriction of Hazardous Substance (RoHS)
– Good Hygiene Practice (GHP)
– Regulatory Impact Assessment (RIA)
– Factory renovation for compliance to certification requirements
– Other related costs to comply to the requirements of standards and certification
Matching Grant for Market Development
– Participation in Trade and Investment Missions
– Specialized Marketing missions and In-store Promotion
– Export market study up to a maximum matching grant of RM30,000
– Industry related conferences
– Participation in local and international trade fairs
– Preparation of Promotional items up to a maximum matching grant of RM15,000
– Setting up of sales promotion office overseas up to a maximum matching grant of RM50,000
Matching Grant for Enhancing Product Packaging
– Related costs and services for designing, packaging, marking and labelling
– Trade mark and patent registration
– Purchase of machinery and equipment subject to maximum matching grant of RM100,000
Clothing deflation set to ease off: some products will become more expensive
Over the past five years, British consumers have enjoyed the benefits of rapid clothing deflation which has brought them, year on year, cheaper apparel products from skirts, to T-shirts. However, according to analysis from Verdict Consulting, this trend is now coming to a close and while prices will remain relatively low over the next five years, shoppers should not expect to continue seeing the dramatic falls in price they have witnessed in the past. Indeed, in some categories apparel prices are likely to increase.
Verdicts analysis shows that between 2003 and 2007 deflation has been a constant feature of the clothing market and, over this period, prices have fallen by an average of 10%.
Verdict is forecasting that by 2010 price inflation will have crept back into the clothing market, bringing to an end a 12 year period of continuous price deflation. Over the next five years apparel prices will increase by slightly less than 1%. According to Verdict there are three main factors behind the reverse of the deflationary trend.
First, having already secured many of the financial benefits of international sourcing, it will be very difficult for retailers to extract significant extra savings from moving production to ever cheaper locations. Over the past five years, reducing manufacturing and production costs has been instrumental in allowing retailers to cut prices without seriously damaging their margins. Going forward, retailers will not have this ability and, therefore, will be much more constrained in terms of reducing their prices. Moreover, a greater focus on ethical sourcing by consumers will mean retailers need to be far more careful in terms of their sourcing policies: something that could also constrain their ability to reduce production costs.
Second, the cost of doing business is increasing rapidly.
Third, UK consumers are saturated with clothing: the average woman, for example, buys twice as many clothing items per year today as she did back in 1995. The effect of this is that reducing clothing prices is unlikely to stimulate demand and result in retailers selling more volume, as has been the case in the past. As a consequence, many retailers have started to focus on adding value to their clothing ranges and encouraging consumers to trade up to more expensive products. This focus on more expensive products will push up average prices.
Low prices are no longer the differentiator they once were the new model is much more about adding value and providing clothing that is aspirational or different. To an extent people are bored with clothing shopping: they do like low prices, but they also want to be inspired and they re prepared to pay for the privilege.
The days when clothing retailers could simply reduce their prices and expect to sell more as a result are drawing to a close.
The policy change will have a big negative impact on textile companies that aren’t competitive, especially those that produce low-priced clothing and materials.
China Clothing Industry Profit Likely To Drop
Expected export value of China’s textile and clothing in 2007 would touch US $165 billion, with a rise rate of 16 percent over 2006. The growth rate in 2006 was 25 percent.
This year, because of drop in export rebate rate, Chinese clothing industry will lose an income of 4.8 billion yuan in the second half of this year and the profit rate would fall by 0.26 percent.
Below are new export rebate rate on some commodities after deduction:
1. Plant oil : 5 percent;
2. Chemical products : 9 percent or 5 percent;
3. Plastics, rubber and their products : 5 percent;
4. Box and bags : 11 percent, the leather products : 5 percent;
5. Paper products : 5 percent;
6. Wearing apparel : 11 percent;
7. Shoes and hat, umbrella and feather products : 11 percent;
8. Stone materials, pottery, glass, pearl, gem, noble metal and its products : 5 percent;
9. Furniture : 11 percent or 9 percent;
10. Wooden products to 5 percent
11. Toy : 11%
12. Viscose fiber : 5 percent
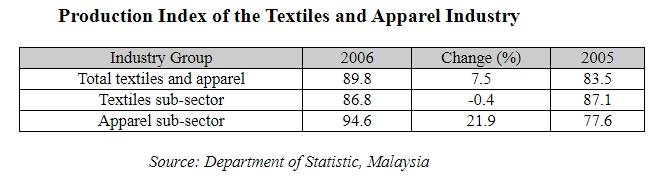
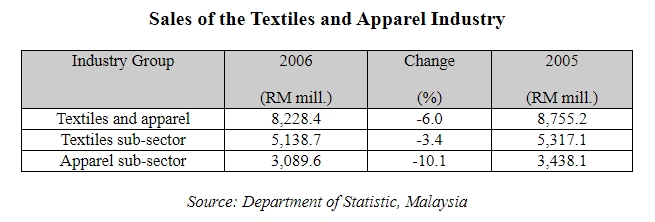
Employment
Employment in the textiles and apparel industry decreased by 2.2 per cent to 65,023 workers in 2006, compared with 66,506 workers in 2005. This was due to increase automation in the production processes and outsourcing of labour intensive activities from low cost producing countries, such as Viet Nam.
Productivity
The textiles and apparel industry registered a decline in Sales Value per Employee of 1.5 per cent to RM128,090 in 2006, compared with RM130,050 in 2005. Labour Cost per Employee and Unit Labour Cost increased by 1.3 per cent and 2.8 per cent, respectively. In 2006, the textiles sub-sector recorded an increase of 3.7 per cent in Sales Value per Employee. The sub-sector was able to sustain its labour cost competitiveness as indicated by a decrease in both Labour Cost per Employee and Unit Labour Cost by 0.1 per cent and 3.6 per cent, respectively. The Sales Value per Employee of the apparel sub-sector decreased by 8.0 per cent to RM75,750 in 2006, compared with RM82,300 in 2005. The sub-sector registered growth in Labour Cost per Employee and Unit Labour Cost by 2.6 per cent and 11.5 per cent, respectively.
Productivity Indicators of the Textiles and Apparel Industry
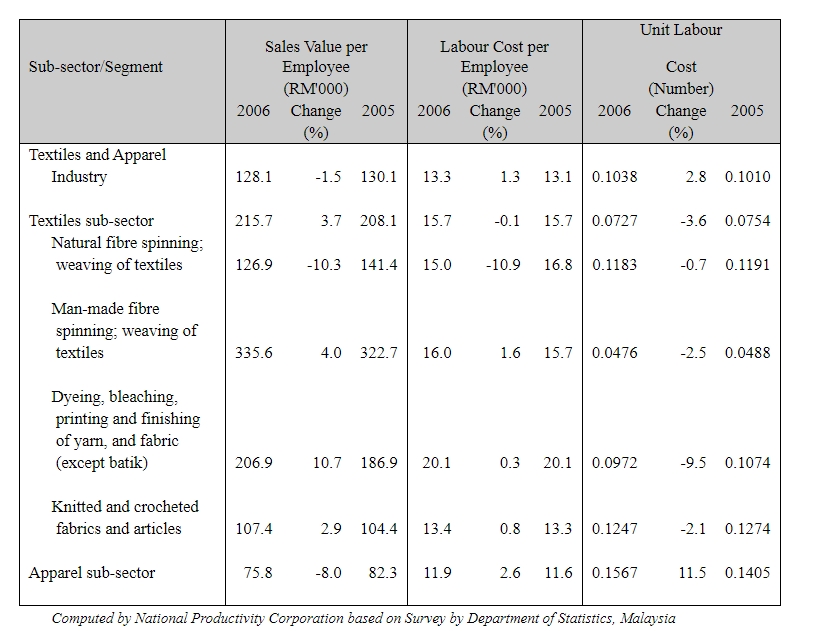
Malaysia’s textile sector has experienced a severe downturn during the first half of 2007, with monthly output declining for the past five months of 2007.
The cotton-weaving sector has led this weakness, with May cotton fabric production falling 20.7 percent from the previous year, while January through May cumulative cotton fabric output dropped 7.1 percent to 62.882 million square meters.
In contrast, monthly apparel output has continued to expand. May apparel output posted 9.2 percent year-on-year growth, reaching 8.666 million units, while January through May cumulative apparel output grew 14.1 percent to 37.384 million units.
The industry’s problems are tied to a sharp reduction in exports. January through May cumulative textile and apparel exports fell 16.3 percent to RM3.996 billion (continued appreciation in the Ringgit has hurt the sector’s competitiveness).
Export volume to the U.S., the top export destination, sharply declined during the first half of 2007, incurring a loss of 16.5 percent in January through May. On the other hand, apparel exports actually posted 1.5 percent growth during this period, but textile exports to the U.S. have plunged 44.8 percent in volume. This is at the heart of the downturn in textile output.
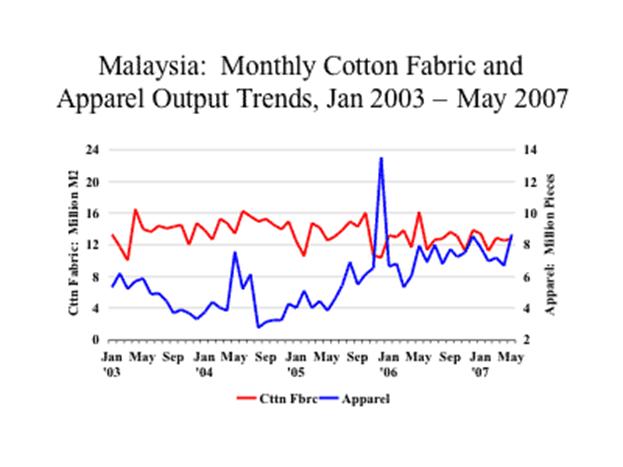
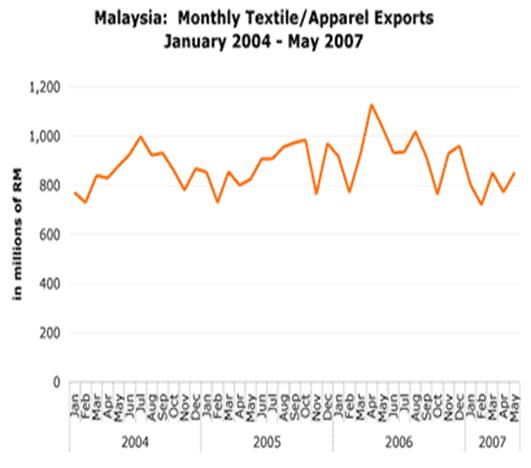
The agency found that Korean textile companies invested 10% less in China while increasing their investments in Vietnam by 54% in 2006, making Vietnam the second largest investment destination.
In addition, Indonesia was also considered for investment by Korean textile manufacturers.
The textile export bidders were attracted to a handful of popular categories of exports going to the US. Exporters of cotton trousers and fiber woven shirts won bids for 93 percent of the quotas in these categories, while the bidders only won less than 60 percent of those for bras and fiber trousers.
China lowered the export tax rebate rate for garments to 11 percent from July 1, and listed yarn and cloth as processed goods subject to export limits in August, impacting textile exporters.
The top five municipalities and provinces by the number of bid winners were Guangdong (817), Zhejiang (461), Jiangsu (355), Shanghai (201), and Shandong (118).
CLOTHING has been added on the list. Almost all the added items have a double duty made up of a percentage of the actual value, usually 60 percent for clothing, plus a fixed US dollar charge, often US$10 a kilogramme for clothing, for example.
Clothing now attracts 60 percent duty plus a fixed US$10 a kilogramme. Items covered include men’s, boys’, women’s and girl’s coats, suits, blazers and dresses, jerseys, pullovers, babies’ garments, clothing accessories, gloves, shawls, tracksuits, overcoats, dressing gowns and girls’ nighties etc.
The deal will raise Reliance’s polyester-making capacity by 25% to 2.5 million metric tons a year. The purchase will increase Reliance’s share of textile polyester to more than 7% of the global market.
For the year ended March 31, 2007, Reliance Industries posted revenue of 1.109 trillion rupees ($27.38 billion) and net profit of 109.08 billion rupees (US2.69 billion).
Hualon has a polyester-producing capacity of half a million metric tons a year. Hualon has further processing capacity to make 30,000 tonnes of nylon, 150,000 tonnes of PET bottle grade chips and about 400-500 million yards of fabric a year. Reliance says that Hualon’s turnover of $800 million can be taken up to $1 billion.
Through the buy, Reliance will also have a ready market for products from its refineries such as PTA [purified terephthalic acid] and MEG [monoethylene glycol]. PTA and MEG are formed by refining crude oil and are used as raw materials for the manufacture of polyester staple fiber and polyester staple yarn.
Hualon is significant to the forward side with blended yarn, textured yarn and fabrics which is largely being exported to America and Western Europe, will give Reliance Industries a presence across the value chain — from polyester manufacturing to textile production.
The office of EU trade commissioner Peter Mandelson has decided not to renew restrictions on Chinese textile imports imposed in 2005.
It informed the Italian government on Sept 10 2007 that there is no leeway for an agreement with China to prolong the restrictions, and quotas on Chinese imports will be removed Jan 1 2008.
The EU commission will, however, set up with China a system to monitor imports.
Textile-producing nations Italy, France and Spain had asked the commission to maintain import restrictions for at least another year.
On the other hand, the US safeguard quotas on 34 individual categories (21 combined categories) of Chinese apparel and textiles are set to expire on December 31, 2008. Because of better quota allocation and due to growing concerns over Vietnam, a number of quota categories could possibly fill and embargo before the end of this year.
Malaysian exporters have the opportunities not only to do business with the small specialised independent UK suppliers but also the big high end stores such as the Selfridges, John Lewis, Debenham and House of Fraser. The UK clothing sector is extremely competitive however niche opportunities for Malaysian exporters exist for innovative design and fabrics, high quality, high end products, designer-wear, swimwear and surf/streetwear. Companies may email to MATRADE’s Trade Commissioner in London at london@matrade.gov.my for further details.
On 30 October 2007, NCTO (The US National Council Of Textile Organizations) detailed 73 subsidies which the Chinese government offers to its surging textile industry and urged US Congress to pass meaningful currency legislation, among other steps.
Regarding the 73 subsidies, NCTO stated that 24 of those subsidies contained illegal export requirements, 16 are subsidies for technology upgrades and research and development, 11 offer income tax reductions or holidays while eight subsidize loan costs or offer loan forgiveness. Other subsidies include land grants, lower utility costs, brand development grants, VAT exemptions, raw material rebates and worker benefit exemptions.
NCTO noted that with massive amount of government financial support, China’s textile industry is now growing so quickly that within five years it would employ more people than the entire U.S. manufacturing complex. Among the key facts NCTO related:
Size of China’s Textile and Apparel Export Sector
At current trends, China will surpass 50 percent of the world trade in apparel within the next four years. Today, China exports nearly four times as much apparel as the next largest exporter (the EU) and that gap is widening rapidly.
During the last ten years, the Chinese textile sector has purchased 65 percent of all knitting machines, 62 percent of all weaving machines and 46 percent of all spinning machines sold in the world. To put this in another context, Chinese manufacturers buy an average of ten times more knitting, weaving and spinning machines than their next largest competitor.
Resulting Chinese growth has been stupendous. Chinese textile and apparel exports climbed 16% in 2002, 28% in 2003, 21% in 2004, 21% in 2005 and 25% in 2006. Chinese textile industry production and output statistics reflect the same dramatic increases with capital assets, employment and sales up double digit and in some cases (sales), triple digits.
Impact of Upcoming U.S. and EU Safeguard Removal
NCTO warned that with the China safeguard expiring soon in the U.S. and EU, textile and apparel producers around the world are in jeopardy. NCTO noted if China merely follows past history, it will take 65 percent of the U.S. and EU apparel markets once the remaining safeguards are removed. In dollar terms, this means China will take $44 billion in export trade currently held by other countries.
These quantitatively safeguards cover roughly 50 percent of the apparel trade, including the big “bread and butter” categories such as trousers, woven shirts, knit shirts, underwear and t-shirts. These safeguards will be expiring soon – in 2008 in the EU and in 2009 in the United States.
In the US, China’s share in apparel categories that have been removed from quota for more than three years has increased from 19 percent to 65 percent. Chinese exports in these categories have increased by 436 percent in just the past five years. These categories include a wide range of apparel products, including children’s clothes, gloves, pajamas, ties, winter jackets and silk and linen clothing.
In apparel categories where quotas were removed in 2005, China’s share has increased at a similar pace, rising from 15 percent to 52 percent during the last two and half years and is continuing to increase. These categories include an even wider variety of products, including cotton and man-made fiber dresses, coats, skirts, blouses, nightwear and all wool apparel except suits and trousers. At current trends, China’s market share will hit 66 percent sometime in 2009.
China’s share in the EU non-safeguard categories is similar. China’s share of the EU market in apparel categories that have been quota free for more than three years increased from 25 percent to 66 percent from 2001 to 2006. China’s exports in these categories increased by 404 percent. In apparel categories where quotas were removed in 2005, China’s share has increased from 24 percent in 2004 to 41 percent in 2006 and is projected to hit 50 percent in 2007. If current trends continue, China’s market share will hit approximately 66 percent sometime in 2009.
According to UN trade figures, in Japan and Australia, China’s share of their apparel market is an astonishing 89 percent. This poses the very real possibility that over time China could eventually take an even larger share of the U.S. and EU and establish a virtually monopoly in the world’s two largest consumer markets for these products.
At a 65 percent share of the U.S. and EU markets, China will be positioned to increase its apparel exports by nearly $45 billion over a five-year time frame.
Logically, these enormous Chinese increases mean equally enormous decreases by other exporters. These “donor” countries are already known: the major suppliers in the Western Hemisphere (Mexico, the CAFTA countries, the Andean countries), the AGOA countries and a large number of Asian exporters (particularly Pakistan, Sri Lanka, Korea, the Philippines and Indonesia). In addition, recently created preference zones for Egypt, the Gaza Strip and Jordan will come under severe threat.
for Textile Exports to the EU
Export licences will be issued on China’s side, but without limits and under an automated process. A series of conditions for being granted export licences were revealed on 17 October, leading to a possible restriction in exports to the European Union.
The system will be managed by the China Chamber of Commerce for Import and Export of Textiles, in association with the China National Textile and Apparel Council and the China Association of Enterprises with Foreign Investment. In order to apply for export licences, Chinese companies will need complying with following requirements:
1. Have a registered capital of more than 500,000 yuan in mainland China.
2. Having exported textiles and/or apparel in the past two years.
3. Having exported textiles or clothing to the European Union worth a minimum of US$10,000 in the previous year.
4. Not having violated China’s rules related to intellectual property rights or environmental protection in the past three years.
5. Being a member of the China Chamber of Commerce for Import and Export of Textiles.
Under the agreement, the double-checking system will cover eight categories of products: 4 (T-shirts), 5 (pullovers), 6 (men’s trousers), 7 (women’s shirts, blouses), 26 (dresses), 20 (bed linen), 31 (bras) and 115 (flax yarn). Categories 2 (cotton fabrics) and 39 (woven table linen) are excluded, being no more considered “sensitive”.
The system is set to expire at the end of 2008, in line with the end of textile safeguards granted to the European Union and the United States under China’s WTO accession protocol.
Malaysia and Pakistan have signed a trade pact, Malaysia’s first bilateral free trade agreement (FTA) with a member of the Organisation of Islamic Conference (OIC).
The Closer Economic Partnership Agreement (CEPA) was signed on 8 November 2007 and will come into force from 1 January 2008. It will further strengthen trade and investment and bilateral economic and industrial cooperation on a long term basis between Malaysia and Pakistan.
Both countries concluded talks in October 2005, and began implementing in January last year an Early Harvest Programme (EHP) for trade in goods comprising Malaysia’s offer of tariff cuts on 140 tariff lines and Pakistan’s offer of tariff cuts on 124 tariff lines.
For trade in goods, both Malaysia and Pakistan will progressively reduce or eliminate tariffs on agricultural and industrial products.
Modalities for Reduction and Elimination of Tariffs
Malaysia will eliminate import duty by 2012, on 74.5 per cent of tariff lines, comprising 77.3 per cent of imports from Pakistan with a value of RM152.7 million in 2006; and reduce import tariffs over a period of five to seven years, on 18 per cent of tariff lines with a value of RM5.95 million in 2006.
In turn, Pakistan will eliminate duties by 2012, on 43.2 per cent of tariff lines involving agricultural and industrial imports from Malaysia worth RM633.7 million in 2006.
Rules of Origin (ROO)
To ensure that no circumvention takes place and preferential tariff is applied on the goods originating from the respective FTA partners, the provisions of Rules of Origin of the agreement would be followed by both the countries.
Under MPCEPA, products from Malaysia or Pakistan eligible fro preferential tariffs must comply with the following criteria :
For most textiles and textile products, the Rules of Origin will be change of tariff heading (CTH) or 40% RVC (regional value content i.e. 40% local content from any or both parties), while some specific lines (e.g chapter 50 & 51) will applied under the product specific processed rule. Please refer to MITI or MKMA websites on the reduction schedules and the ROO guidelines and procedures.
Last year, Malaysia’s total trade with Pakistan amounted to RM3.306 billion comprising exports worth RM3.089 billion and imports RM217 million.
Trade during January to September 2007 amounted to RM3.243 billion comprising exports of RM3.016 billion and imports RM227.3 million.
Major exports to Pakistan last year were palm oil and products, chemical products, electrical and electronic products, machinery and parts, and textiles and clothing.
Meanwhile, major imports from Pakistan in 2006 were textiles and clothing, fresh and frozen seafood, cereals including rice, electrical and electronic products and chemicals and chemical products.
Pakistan has gained market access for their core products like cotton yarn, cotton textiles, bed linen, home textiles, jewellery, mangoes, some engineering goods, leather products and minerals etc.
Cumulative Malaysian investments in Pakistan as at 2006 amounted to RM651 million which include investments in power generation, property development, construction, telecommunications, palm oil processing, and oil exploration.
Meanwhile, Pakistan’s cumulative investment in Malaysia in manufacturing projects as of August 2007 totalled RM49.2 million and are mainly in food processing, textiles and textile product, wood and wood products, chemicals and chemical products, transport equipment and rubber products.
The pact provides Pakistan 100 percent equity in Malaysia in the field of computer and IT related services, Islamic banking and Islamic insurance (Takaful). Pakistan will be the first country, which has been offered 100 percent equity in these sectors by Malaysia.
Both countries will review the MPCEPA every five years.
Pakistan will authorise Trade Development Authority of Pakistan (TDAP) to issue certificate of origin to the exporters. In the case of Malaysia, the certificate of origin shall be issued by Ministry of International Trade and Industry (MITI).
Monthly exports of textiles and apparel have incurred losses for eight consecutive months. July exports fell 5.4 percent to RM884.1 million, while January through July cumulative exports have fallen 12.1 percent to RM5.837 billion. This downturn has been even greater in quantity terms due to a sharp increase in the average export price per unit.
The steady appreciation in the Malaysian Ringgit against the U.S. dollar has undermined its market share in the U.S., which is the Malaysia’s top export market. January through August exports to the U .S. market declined 21.15 percent, with apparel exports dropping 6.78 percent and non-apparel exports decreasing 44.97 percent.
MKMA received with thanks season greetings (Hari Raya, Christmas, Lunar New Year) from the following organizations :-
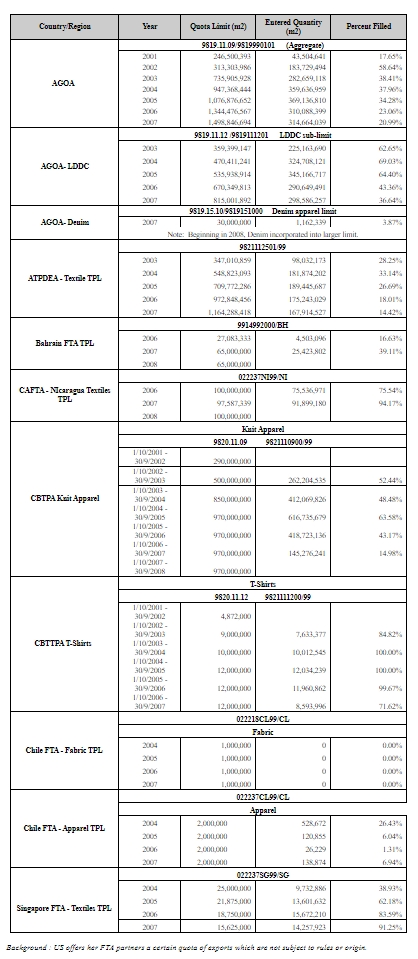
Rising consumer spending, increased tourism and rapid growth in new malls and shopping centres is driving massive growth in the Arabian Gulf clothing market.
The United Arab Emirates and Dubai in particular, is leading the way as it vies to become one of the world’s fashion capitals and bids to attract 15 million tourists annually by 2010. Dubai is already the major regional hub for textile imports and re-exports.
Regional Textile Trading Hub
Recent statistics from UK-based research company Retail International confirm Dubai’s dominance with 30% of the total retail space in the Gulf Co-operation Council (GCC) region. In 2008, Dubai will also become home to five out of the world’s seven largest shopping malls.
Dubai has secured its position as the regional textile trading hub according to a recent report by the Emirates Industrial Bank. In 2006, Dubai’s textile imports were valued at $3.75 billion – an average increase of 11% over 2002. Dubai saw an even higher surge in terms of re-exports with 13.3% growth during the period from 2002 to 2006 to almost $2 billion.
Dubai Textile City
The opening last year of the six million square feet Dubai Textile City gives a further boost to the textile trade in Dubai. Fabrics are mainly imported from South Korea, Japan, China, India, Indonesia and Thailand. These products are further re-exported to countries including Iran, Iraq, Saudi Arabia, East Africa and former Soviet Union states.
Dubai Textile City is expected to become the Middle East point of reference for trade to and from Europe, China, India and even the USA and is spread over six million square feet just ten minutes from Dubai International Airport. The zone’s tax-free status will attract global players, giving the $3 billion market a boost. Setting up business there entitles owners to 100% import and export tax exemptions, no corporate taxes for first 15 years, no personal income taxes as well as additional support services such as sponsorship and housing.
The government has also announced its policy for personal vacations. Employees of government agencies and state-owned companies, as well as private companies, are to be given paid vacations, taken on their own schedule after one year of service. Employees with 1 to 9 years of service will be entitled to five paid days off, 10 – 19 years will receive 10 paid vacation days and 20 years or longer will get 15 paid vacation days.
Since January of 2007, the US Department of Commerce (DOC) has conducted a programme of monitoring garment imports from Viet Nam.
Vitas has retained an American law firm, Sidley Austin LLP, not only to help Vitas members self-monitor exports to the US but also to lobby with US officials and trading partners and the WTO to overturn the DOC monitoring system, calling it an unfair trade barrier contrary to WTO rules.
Deputy Minister of Industry and Trade Bui Xuan Khu noted that US laws were complex and American garment makers were attempting to protect the domestic market by lobbying the US Congress and the DOC to take measures to hinder Vietnamese garment imports. The DOC monitoring programme was a representative example.
The US is Viet Nam’s biggest apparel export market, buying about 56 per cent of all garments exported. The US market is expected to be worth of $5.3 billion of the total of $9.5 billion worth of garments next year.
Based on these figures, total fees collected through the Vitas levy would amount to about $530,000 in 2008.
Vitas will ask customs offices to collect the fees on each lot of garments exported to the US and transfer the funds to an account that would be supervised by the Ministry of Finance and garment industry representatives.
Dog clothing in Thailand has grown into a booming industry as dog lovers are willing to pull out their wallets to clothe their furry companions.
Viriya Chansavangvong started her dog clothing business two years ago. The business was doing well because many dog lovers liked to dress up their dogs, following human fashion trends or special occasions.
The dog clothing business originated in western countries, to warm dogs during winter.
Viriya said her clothes, cost only around 170 – 290 Baht. Her dog boutique also provided dog shoes, which could help prevent possible scratches on furniture and muddy paw prints.
The dog clothing business makes Viriya a monthly income of around two million baht. It had increased one hundred percent from last year, with Japan remaining the major dog clothes’ importer.
Viriya said the future of the dog grooming business was still bright due to there being only a few producers in the market. Still, the producers need to keep creating new things to respond to the demands of dog lovers, who seek to pamper their pets.
The European Community and Eastern and Southern Africa States (ESA) have concluded negotiations on an Interim Agreement that will establish an Economic Partnership Agreement (EPA) in 2008.
On the ESA side, the Interim Agreement was signed by Kenya, Uganda, Rwanda, Burundi, Mauritius, Seychelles, Zambia and Zimbabwe, with others namely Comoros, Madagascar and Malawi, expected to sign the Interim Agreement in the coming days while, DRC, Djibouti, Eritrea, Ethiopia and Sudan may join later.
On the trade provisions, the EC will grant duty free quota free market access to all goods exported by ESA states except for sugar and rice which are subject to short transition arrangements.
On textile and clothing, the EC agreed to provide the singl e transformation rule of origin. This means that clothing companies established in the ESA Signatory States can now source fabrics from anywhere in the world, transform them and then export these goods to the EU free of both duties and quotas.
On their part, the ESA States have agreed to gradually liberalize 80 per cent of their trade for imports from EU covering mainly capital, raw material and intermediate products over a period of 15 years with an initial 5 year preparatory period.
The Mercosur Common Market has issued its final technical regulations for new labeling requirements for textile and apparel imports. The market’s domestic textile sector is continuing to battle a surge in imports, so in an effort to counteract this growth is issuing new regulations requiring labels to contain the following:
This information has to be presented in the consuming country’s language. All member nations of Mercosur are to incorporate the new requirements by July 1, 2008.
The US National Council of Textile Organizations (NCTO) announced on 14 January 2008 that it has begun an online customs fraud reporting system and has distributed new customs fraud reporting tools to its member companies and the public at large. NCTO is urging anyone who is aware of customs fraud in textiles and apparel to utilize the forms.
The new tools include a one page form that can be filled out online and sent electronically to NCTO on a confidential basis. NCTO will then forward the information to U.S. Customs and can, if requested, delete the reporters name. All information will be held on a business confidential basis. The new forms are available at www.ncto.org under “Report Customs Fraud”.
The forms were developed in consultation with the U.S. Customs and Border Protection and are designed to streamline the reporting process and provide more detailed information to U.S. Customs and Border Protection.
Mike Hubbard, NCTO Vice President, said “Customs fraud has risen to become the number one issue we get calls about from our member companies. Our members are extremely frustrated because they see high levels of fraud without a corresponding increase in Customs activity.”
NCTO has been meeting with U.S. Customs regarding a sharp drop-off in seizure and detentions and in special operations during a time of increasing reports of fraud from NCTO member companies. The drop-off coincided with the textile division was being moved out of the Operations Division last year and into a policy branch. Customs enforcement became a key issue for the industry during the CAFTA debate after the industry learned that Customs had not hired new textile enforcement personnel as mandated by Congress in 2002.
Against the backdrop of the ongoing process of globalisation which has virtually broken many trade barriers and unleashed fierce competition among supplying nations and also provided incredible opportunities to many, Malaysia seems to be retreating into a cocoon of complacency which, many experts fear, could be fatal for the country’s exports on long- term basis.
Malaysian companies complain that costs of participation in a trade fair in a developed economy like Germany are high, but this argument fails when one sees that many less-fortunate countries with limited or no resources at all, are faithfully participating in shows year after year, and also reaping the benefits later. Thus, the argument of Malaysian exhibitors is myopic and, as one German buyer put it, “penny wise and pound foolish”.
Nowhere is this more conspicuous than in Malaysia’s textile sector. The just-concluded Heimtextil trade fair of Frankfurt, rated as the world’s largest home-textile trade show, provided a glaring example of how Malaysian textile companies are missing out on opportunities while trying to save costs by not participating.
Kenneth Fong, the Malaysian representative of Messe Frankfurt, the organiser of Heimtextil, said Malaysia’s exporters were losing out because they were unable to see the level of development in the global textile industry.
Fong said Malaysian exhibitors could claim 50 percent reimbursement of their participation costs from Malaysia External Trade Development (Matrade) and small- and medium-sized enterprises might even be entitled to tax incentives.
He urged Malaysians to be more pro-active in the export markets.
Olaf Schmidt, the vice president (textile fairs) of Messe Frankfurt, advised Malaysians to closely monitor trends and study the markets.
He said many buyers sourcing their products from Asia were overwhelmed by the large presence of exhibitors from India (389), China (309) and Pakistan (168).
“But even smaller nations such as Bangladesh (23), Singapore (25), South Korea (28), Taiwan (59) and Vietnam (10) had a strong presence. Malaysia had only one exhibitor at the show,” he said.
Helmut Jansen, an oursourcing agent for major German textile houses, said Malaysia’s textile industry would miss the bus if it continued to keep away from the Frankfurt.
“I source mainly from Vietnam, China, India and Pakistan. And I may do so from Bangladesh in the future,” he said.
In the United States, there are approximately 63,000 apparel and accessories stores. As the U.S. apparel industry is largely dependent on manufacturers in other countries, foreign sourcing is not a choice but a necessity in competitively offering apparel and related products to customers.
A survey was carried out from fall 2006 through spring 2007 on US small-business retailers (having 1 to 500 employees). The Survey Results reveals:
How do these small businesses locate manufacturers for their apparel?
A higher percentage source their products from foreign manufacturers through independent intermediary agents (a trading company, import broker, buying office, etc.) in the US rather than directly from foreign suppliers. Over 40% use intermediary sources in the United States to find foreign manufacturers for 51–100% of their merchandise. A notable majority (68%) do not source directly from overseas manufacturers without the assistance of intermediary agents for any of their products.
Who makes most of the products these small businesses sell?
Brazil, Canada, China, Vietnam, Germany, India, Italy, Japan, Korea, Mexico, and Thailand are among the top manufacturers. Trade shows are a key source of information on foreign sourcing for small businesses in addition to buying offices, chambers of commerce, trade publications, sales representatives, professional contacts, the Internet and e-mail, and word of mouth.
Benefits of Foreign Sourcing
§ Increased profit margins
§ Effective way to develop private labels
§ Greater variety of products provided by foreign manufacturers.
Quality, delivery time, customer service, and custom-designed products were not cited.
Top 10 barriers to Sourcing from Foreign Manufacturers
§ Long shipping time and/or slow replenishment
§ Limited information about foreign manufacturers
§ Problems communicating with foreign manufacturers
§ Difficulty in settling disputes
§ Excessive transportation/insurance costs
§ Difficulty identifying foreign manufacturers
§ Verbal/non-verbal language differences
§ Increased managerial time to deal with imports
§ Unfamiliar importing procedures/documentation
§ Unfamiliar foreign business practices
Reliance on Intermediaries
Basically, retailers are willing to give up some of the profit margins they might have achieved from directly sourcing, to have someone else take care of potential problems that might arise in direct sourcing like packaging/labeling requirements and meeting product quality standards/specs.
Higher perceptions of problems in obtaining credit from non-U.S. manufacturers were significantly. Obtaining credit is a true barrier to retailers that wish to source from abroad.
The study found that retailers who believed poor standards for labor practices to be potential problems and therefore barriers were less interested in sourcing from foreign manufacturers. This finding suggests some level of awareness among small business retailers concerning social responsibility issues and that these issues do, in fact, influence their tendencies to do business. It appears that small retailers are attempting to use intermediaries as buffers.
Cheong Kwok Wah
2008 promises to be an eventful year by any standards we have seen. The textile industry is faced with several challenges globally and locally as we usher in the New Year. Crude Oil Prices has remained high in the 90’s since the last quarter of 2007 and raw cotton prices are also around 70 cents /pound for already over half a year as compared to low 50 cents/pound over a year ago. This has happened despite downstream yarn and garment prices remained unchanged during the whole period. This evidently points to an excess capacity situation in the textile industry all over the world.
The following scenario is expected to prevail during the course of the year affected by both international and local events:
2008 promises to be a very challenging year indeed.
However I have also envisaged some hopes that the following changes that might happen and will mitigate the above negative factors and bring in new life to the textile industry.
Again to survive we have nevertheless have to work hard and convey to the government of the day what needs to be done in order for the textile industry to stay afloat. Happy New Year 2008 (Year of The Rat) to all our MKMA members.
Small and medium-sized companies suffered the most, with some on the brink of break down.
Industry experts said the appreciation of Chinese currency and rising costs in both raw materials and labors have squeezed the profit margins.
Fujian Nanfang Co, a state-controlled textile firm in southeastern Fujian Province reported 9.53 million yuan ($1.36 million) loss in net profit, according to its 2007 annual report.
It is estimated that every rise of one percent in the yuan would cause a 2 to 6 percent drop in textile commodity profit. The Chinese currency, yuan, has risen about 4 percent against the dollar so far this year.
Meanwhile, demand remained lukewarm largely because of weakening US and European demand and the severe winter storms.
Customer statistics showed that China’s textile and garment exports in February dropped 32.9 percent from the previous month.
China exported a record US$175.616 billion worth of textiles and apparel in 2007, a 19.11% year on year growth. A portion of the growth can be attributed to an increase in the average export price.
Exports increased 53.23% to the ASEAN trade block, reaching US$10.924 billion and were equally divided between textiles and apparel. Shipments to Asia in general expanded 17.66% to US$78.679 billion. Japan was the largest single country market with shipments of US$20.343 billion which reflects 4% growth. Shipments to Hong Kong expanded 1% to US$18.228 billion.
In 2007, China exported USD 600 million (RM2.04 billion) textiles and apparel to Malaysia.
Approximately 25% of all exports went to Europe, expanding 16.61% to US$43.884 billion, while shipments to European Union member countries fell 0.67% to US$29.214 billion. Exports to the USA grew 14.42% reaching US$26.634 billion.
The fastest growing export product group was cotton products which expanded 28.69% to US$72.063 billion.
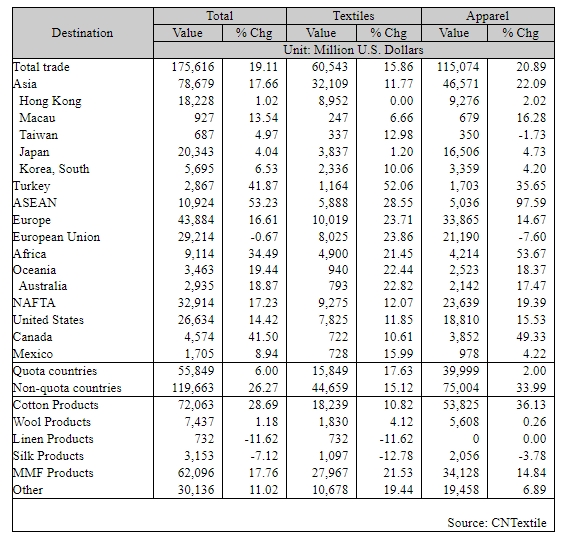
South Korea seeks to revive the textile industry, once one of its main export industries, with new growth engines based on high-tech products such as medical fabrics.
According to the Ministry of Commerce, Industry and Energy (MOCIE), the country exported textile goods worth $13.5 billion (roughly 12.6 trillion won) in 2007, up 2.3 percent from the previous year.
It marked the first upturn in seven years since 2000, when annual exports of textile products reached a peak of $18.9 billion before a gradual decrease thereafter to $13.2 billion in 2006.
After the Korean War (1950-53), South Korea remained a poor country that exported wigs and cheap clothes until the 1960s. In 2006, or just in four decades, it became the 11th country in the world to break the record of $300 billion in exports.
But the textile industry, which represented the country in the era of rapid economic development in the 1970s and 1980s, gave way to the information-technology (IT), automobile and other high-tech industries in tandem with economic growth.
Amid cutthroat competition with other emerging economies such as China, South Korea’s textile industry was hit hard by the liberalization of textile trade in 2005, which further lessened the room for exports.
However, the situation reversed itself last year. Exports rose 2.3 percent from 2006, as oversupply and price-cutting competition were brought to an end. Textile firms also tried to expand production of high-value added goods and fortify overseas marketing.
Government officials predicted that such a trend would continue this year to mark an increase of exports for the second consecutive year. “We expect exports of textile goods will rise 1.6 percent from last year to $13.8 billion”, a MOCIE official said.
He added that, despite some unfavorable factors such as high crude oil prices and the rapid growth of the Chinese textile industry, there are also favorable factors such as the envisioned implementation of the free trade agreement (FTA) with the United States.
The inter-Korean economic project in the Gaeseong Industrial Complex would also help the South Korean textile industry see a larger chance for development and exports.
The government and the business circle agreed to make joint efforts to develop technologies to advance into the future textile markets with high-tech products, such as “smart textiles”, “medical textiles” and “nano-composite textiles”.
“Our textile industry needs to explore new growth engines through convergence with IT, BT (bio-technology) and NT (nanotechnology)”, said Choi Pyeong-rak, who heads the MOCIE’s office of key manufacturing industries.
China had a 40.2 percent share of the U.S. apparel and textile import market in 2007.
However, US apparel imports from China surprisingly fell in December. Total imports from China declined no less than 15% in December from the same month last year at US$1.42 billion.
The latest data seem confirming statements from largest trading houses, announcing a potential shift in sourcing from China to other origins, due to a series of factors like rising yuan and production costs.
US Apparel Imports from China in 2003-2007
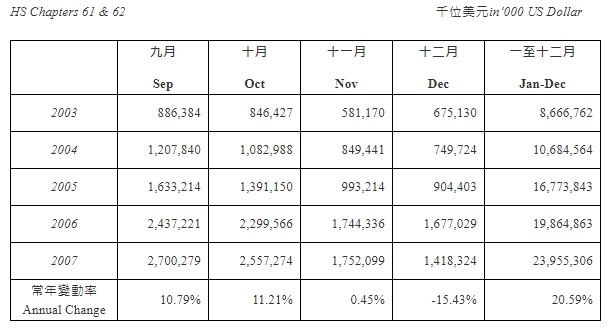
1. Rising Production Costs
Rapid economic growth in China has sparked inflation in several sectors, driving up prices for energy, raw materials, transportation, oil, electricity and labor.
“The overall climate in China has become difficult particularly with significant rise in prices and labor costs,” said Rick Darling, president of Li & Fung USA. “Price increases are real and here to stay, production has begun to migrate to the western provinces and U.S. protectionist attitude is not diminishing.”
2. Yuan’s Appreciation
“An appreciation of the yuan against the dollar of about 13 percent since 2005, have taken a bite out of margins, forcing U.S. companies to recalibrate their sourcing strategies. ” said Rick Darling.
“Chinese companies have been dealing with two things — one is the cost pressure from their inputs and the other is the exchange rate, which has been appreciating,” said Todd Lee, managing director of the Greater China Group. “So far, they have been able to absorb both and not pass it on to U.S. companies, but I’m not sure how long they can hold on without passing the costs on.”
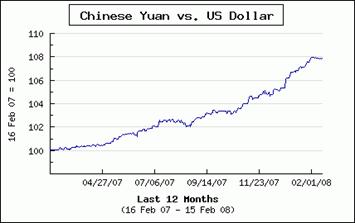
3. US Economic Slowdown
The mortgage crisis has resulted in a slowdown in US retail sales, possibly leading to lower apparel imports in the near term. First data for January are indicating a fall in shipments in volume terms, in most important categories.
In addition to limiting Chinese imports in volume terms, the economic slowdown will force US importers in putting more pressure on prices. This should negatively affect business with Chinese suppliers, who need raising their prices at the same time.
4. Lower Governmental Support
The Chinese government’s latest five-year plan tries to discourage the low-value-added processing exports. Beijing tries now being less dependant on foreign markets by developing domestic consumption.
Tax rebates were reduced from 13% to 11% in 2007 on VAT paid by exporters and should be further cut this year.
A new labour law was just implemented in China which favors employees and should result in a significant increase in production costs. Even if the law is not fully endorsed, as widely expected, wages are being increasing in China, in line with a current jump in inflation, and especially food prices.
5. Elimination of Chinese Quota
A major offsetting factor for U.S. companies making apparel in China would be the elimination of quotas on 34 Chinese apparel and textile import categories. The quotas, part of a bilateral deal between the U.S. and China, are set to expire at the end of the year.
But Ted Sattler, executive vice president of foreign operations at Phillips-Van Heusen Corp., said the benefits accrued from lifting the quotas on Chinese apparel imports might be undercut by potential antidumping and countervailing duty cases in the U.S.
“So it will be the same risk assessment, and, in certain ways, safeguards are more predictable and transparent.” said Sattler.
Darling said Li & Fung does not believe the import restrictions will go away at the end of this year. “Our feeling is that they will continue until 2013 and, if not, other trade barriers like antidumping actions will be used to replace the old quota regimen,” he added.
6. Diversify Sourcing
That paradigm shift in manufacturing, seen in all industrialized countries, eventually could translate into a migration of commodity apparel business out of China, according to Gary Ross, former corporate vice president of Liz Claiborne Inc., who now has his own consulting firm, GERoss Consulting.
“I believe there will be significant closures and consolidation in the apparel sector in China, beginning now and running through 2008 because of the pressures.” said Ross.
Ross said many countries will benefit from the rising costs in China, including Vietnam, Indonesia, Cambodia, Bangladesh and, to a lesser extent, Pakistan. He said apparel manufacturers will begin shifting production from the coastal cities in China to the interior and the north.
Despite the changes, Ross said China will maintain the lion’s share of apparel sourcing because it offers the best prices, consistent quality, completeness of orders and on-time delivery.
U.S. apparel importers showed their move to diversify to other countries last year. Imports from Vietnam, the eighth-largest supplier of apparel and textiles to the U.S., increased 31.3 percent to 1.5 billion SME. Imports from India, the third-largest supplier, rose 2.5 percent to 2.7 billion SME; shipments from Indonesia, the sixth-largest supplier, gained 1.6 percent to 1.62 billion SME, and imports from Bangladesh, ranked seventh, rose 4 percent to 1.55 billion SME.
Overall Trade
The value of Malaysia’s total trade grew in 2007 by 3.67% reaching RM1.11 Trillion from RM1.07 trillion registered in 2006. Exports, which accounted for 54.5% of Malaysia’s total trade, increased by 2.7% to RM605.1 billion, while imports rose by 4.9% to RM504.57 billion.
Textiles and Apparel Exports Performance
Textiles and apparel accounted for 1.7% of Malaysia’s total exports and 2.3% of Malaysia’s manufactured exports. Exports of these products decreased by 3.2% to RM10.26 billion in 2007 from RM10.6 billion in 2006.
Exports of textiles, valued at RM5.29 billion in 2007, accounted for 51.6% of total exports of textiles and apparel. This was a decrease of 4.9% from RM5.57 billion in 2006.
Apparel exports accounted for 48.4% share, with a value of RM4.97 billion. Apparel declined by 1.3% from RM5.04 billion in 2006.
The top five export destinations for textiles and apparel were the USA, Turkey, Japan, Singapore and PRC. Altogether, these five export destinations contributed 48.1% of Malaysia’s textile and apparel exports.
The USA, Malaysia’s leading export destination, which accounted for 25.9% share, registered a decline of 8.9% to RM2.66 billion from RM2.92 billion. There was a downward pressure on the prices of Malaysia’s exports, due to competition from countries such as the PRC, Vietnam, India and Sri Lanka.
Export to Turkey increased by 13% to RM748.7 million from RM662.7 in 2006. Turkey, the second largest export destination, accounted for 7.3% share of Malaysia’s total textiles and apparel exports.
Markets the recorded significant export growth were Mexico, valued at RM362.2 million, an increase of 133.8%, Brazil (RM150 million, 94.4% growth), the Netherlands (RM141.6 million, 55.7%) and Australia (RM119.5 million, 44.7%).
Textiles and Apparel Imports Performance
Total imports of textiles and apparel increased by 3.9% to RM5.66 billion from RM5.45 billion in 2006. Textiles and apparel accounted for 1.3% of Malaysia’s manufactured imports and 1.1% of Malaysia’s total imports.
In 2007, major sources of imports for textiles and apparel were PRC, with a value of RM2.04 billion and accounting for 36% share of total imports of textiles and apparel. This was followed by Taiwan (RM510.7 million, 9% share), Indonesia (RM486.9 million, 8.6%), Thailand (RM421.4 million, 7.5%) and Japan (RM319.8 million, 5.7%).
Malaysia’s January output of textiles and apparel increased 4.5 percent from the previous year, ending 12 consecutive months of sluggish output, which was attributed to a reduction in exports.2007 textile and apparel exports dropped 5.3 percent to RM10.631 billion.
A major improvement in cotton fabric and domestic apparel production was the catalyst for the January rebound. Exports of textile, apparel and footwear also experienced growth in January, increasing 10 percent year-on-year to RM882.8 million.
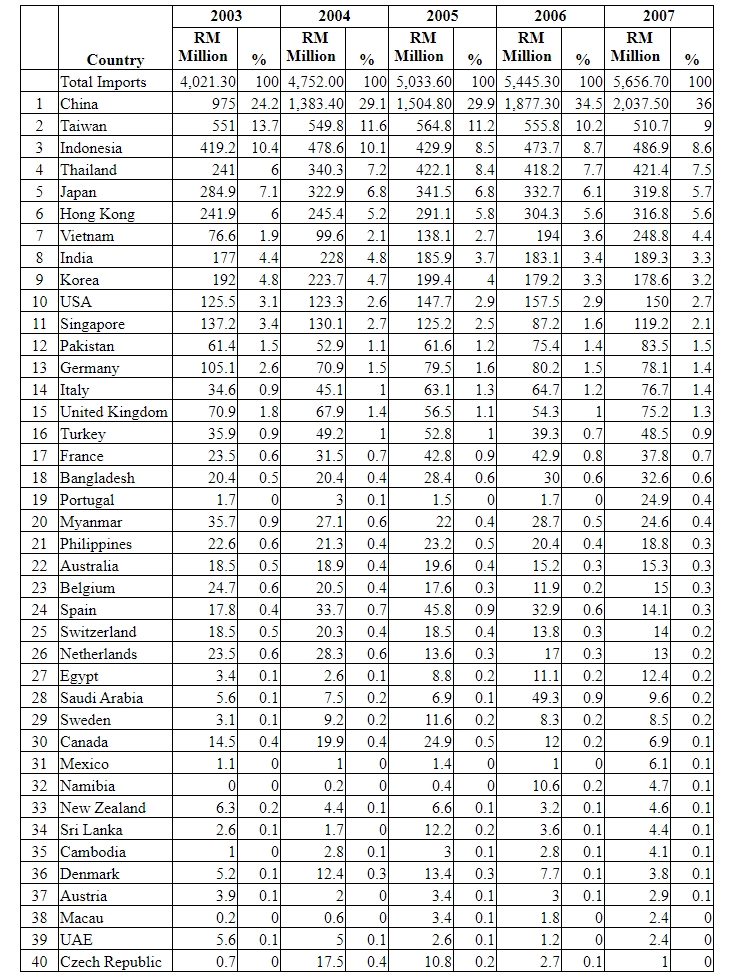
Many of the southern province’s textile firms have been forced to transit from their labor-intensive model to an innovative, environmentally friendly model and even move their production bases to the inland provinces to cut costs.
Labor cost has increased remarkably. The average monthly salary of textile workers in Xiqiao Town of Foshan City, a major textile production base, has reached 1,600 yuan ($228.45) to 1,700 yuan, a 20 percent rise year-on-year. The new labour law taking effect from January 1 this year make it mandatory for Chinese factories to make extra payment for working beyond normal working hours, payment into social and pension funds, besides providing severance pays upon job termination. The average monthly wages in China have risen at 66% between 2004-07.
And what is adding to the woes of the Chinese companies is the currency appreciate. In the January-March quarter, for instance, the Renminbi has risen by as much as 3.96%.
The skyrocketing prices of oil and raw materials are another headache. The wool material price has increased 20 to 30 percent and the coal used in the ironing process increased from 350 yuan to 680 yuan a ton in 2007.
Stricter environmental protection requirements and an electricity bottleneck have also plagued textile firms. Eight printing and dyeing firms in Foshan were closed last year for not meeting the environmental protection standards. This affected the textile industry chain and thus increased the costs of textile firms. In Xijiao Town, 17 printing and dyeing companies invested a total of 60 million yuan to set up pollutant discharge pipes by the end of February
In addition, textile firms in the province have only a four-day electricity supply each week due to a power shortage. This has forced the companies to buy diesel generators and thus increased its costs.
Under such unfavorable circumstances, the textile firms are forced to adapt to the market, standardize their production and develop value-added products to sharpen their edge.
The relocation of factories to the inland regions of the country, where labor and raw material costs are much lower, were among the textile firms strategy to combat the difficulties.
A research said only cost-efficient companies that constantly improved their productivity had a chance of surviving the fierce global competition and growing protectionism.
2008 US retail apparel prices are forecast to rise from last year’s level. Seasonally-adjusted prices in April are 2.5% above average 2007 prices. If this price level is maintained for the remaining months of 2008, this will mark the biggest increase in seventeen years and only increase in a decade.
Imported apparel costs in 2008 are up 1.4% to $3.21 per square meter equivalent (SME) from average 2007 levels, rising for only the third time in a decade.
This higher cost of apparel landed at the port is broad-based across fibers and from several key origins. On average, imported apparel made primarily of cotton, manmade fibers, wool, and vegetable fibers all are more expensive than one year earlier, with only silk apparel costs seeing a decline. Landed costs are higher from key suppliers also, with China, CAFTA, and Bangladesh—three of the largest apparel suppliers to the U.S.—each seeing higher shipment costs than last year.
Several reasons address the rising costs. These include the higher prices of raw materials in apparel production, higher energy and transportation costs, and the eroding value of the dollar.
Finally, reflecting the relatively weaker nature of the U.S. economy against other markets, the dollar continues to plumb new depths against the currencies of major textile and apparel trading partners. These reasons—among others—explain why apparel is getting more expensive at the port and at retail. Also, the issues behind these reasons typically do not reverse quickly, suggesting apparel prices may not return to their deflationary ways in the near future.
Currently, there are 637 licensed companies in operation with investments of RM7.9 billion producing a wide range of textiles and textile products and activities from fibres, yarn and fabrics to made-up garments including dyeing, printing and finishing of yarn and fabrics. In addition, it is estimated that about 1,000 small textile companies which are exempted from manufacturing licenses are in operation.
Malaysian textile producers have sustained their competitiveness through quality improvement, reliability of supply, delivery-time and compliance of international labour standards. Malaysian manufacturers have also implemented automation and computerized manufacturing to reduce production time and increase productivity. By using processes such as CAD/CAM, Malaysian manufacturers are able to meet clients’ requirement for prompt delivery.
22 Projects Approved in 2007
A total of 22 projects were approved in the textiles and textile products industry in 2007 involving investments of RM1.4 billion compared with 30 projects with investments of RM821.3 million in 2006. Of these, 13 were new projects (RM1.32 billion) and nine were expansion/ diversification projects (RM81 million). Domestic investments amounted to RM100.1 million while foreign investments totaled RM1.3 billion.
Of the 22 projects approved, eight projects (RM1.3 billion) were for the production of primary textiles and 14 projects (RM89.8 million) were for made-up garments. The approved projects are expected to generate a total of 9,488 employment opportunities.
A total of 13 projects were Malaysian owned, mainly to manufacture made-up garments. The other projects were for the production of polypropylene woven fabrics and to undertake the activity of bleaching, dyeing and printing of fabrics.
8 Projects in the Primary Textiles Sub-sector
In the primary textiles sub-sector, of the eight projects approved, six were new projects (RM1.2 billion) and two were expansion/diversification projects (RM51.3 million). Domestic investments amounted to RM59.8 million (5%) while foreign investments totaled RM1.2 billion (95%).
The major projects approved included:
14 Projects in the Made-up sub-sector
In the made-up garments sub-sector, 14 projects were approved with investments of RM89.8 million in 2007. Of these, seven were new projects (RM60.2 million) and the other seven were expansion/diversification projects (RM29.6 million). Domestic investments amounted to RM40.3 million (45%), while foreign investments totaled RM49.5 million (55%).
Among the major projects approved were:
The total investments approved in 2007 have achieved the annual investment target under the first five years of the Third Industrial Master Plan (IMP3), which is RM800 million per annum for the period 2006 – 2010. The continued investment interest by investors is an indication that Malaysia, which is known for its ability to produce high quality products and meeting delivery deadlines, is still capable of sustaining its market share in the industry.
Outlook
The Malaysian textiles industry is facing stiff competition from low cost producing countries such as China, India, Viet Nam, Cambodia and Africa. With increasing competition from these countries and to sustain the competitiveness in the global market, the industry players must continue to strive for cost competitiveness by producing high value-added products, enhancing product quality, emphasizing on new designs and product differentiation as well as prompt response to the market requirements.
Efforts will be intensified to promote investment in the targeted growth areas which include industrial and home textiles; functional fabrics; high-end garments; ethnic fabrics; and key support facilities and services. Initiatives will also be taken to encourage Malaysian textile producers to invest in the latest technology/automation to improve efficiency and product quality.
However, for the production of low-end made-up garments which is labour intensive, Malaysian textile producers are expected to relocate their operations to developing countries to take advantage of the lower cost of production and abundant labour supply. By investing in the lower cost producing countries, Malaysian textile manufacturers would be able to maintain and expand their market share.
Shipments destined for the U.S. account for roughly one in five Ringgits of exports from this sector, implying Malaysia’s dependence on the U.S. market. As 2008 Malaysian exports jumped from last year, total U.S. textile and apparel imports from Malaysia climbed in step, up 12.4% from January–February last year. In particular, the volume of U.S. apparel imported from Malaysia rose 28.5% from last year, boosted by soaring manmade fiber apparel imports, soaring 61.0%.
Part of the reason behind the rebound in Malaysian exports—particularly to the U.S.—is in the lower unit costs for product landed on U.S. shores. Year-to-date, the average cost per square meter equivalent (SME) for Malaysian apparel shipped to the U.S. fell 21.3% from this period last year to $2.41/SME, while costs from the rest of the world were flat at $3.21. The divergence in manmade fiber apparel costs is even more pronounced, with Malaysian costs falling 33.1% to $1.66, while rest-of-world costs were mostly flat at $2.70/SME.
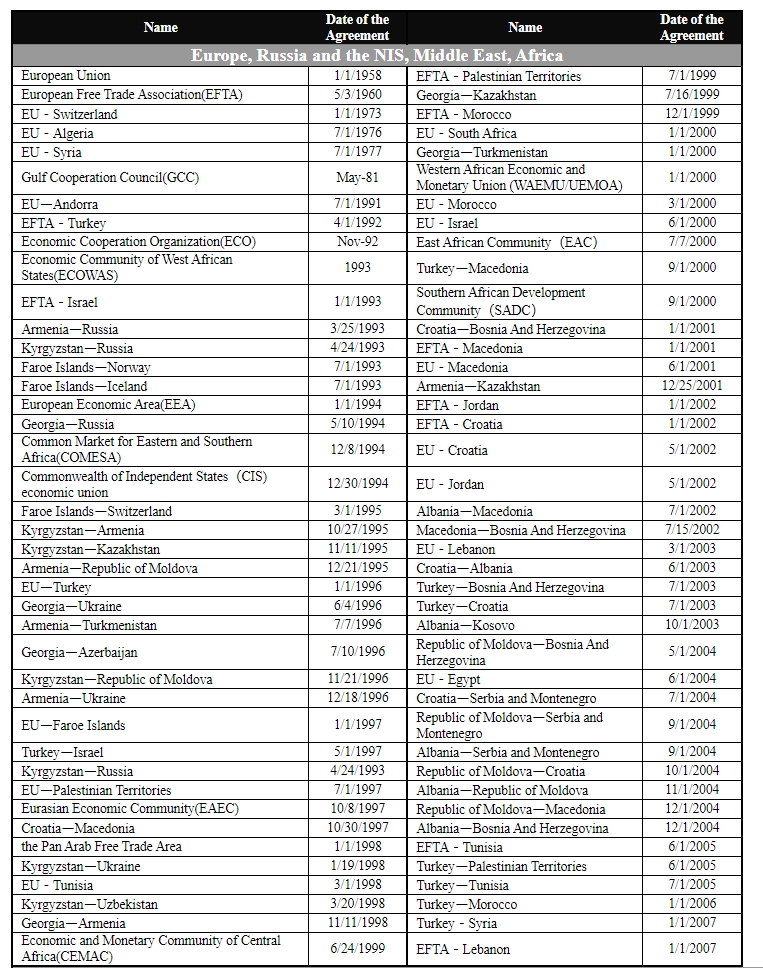
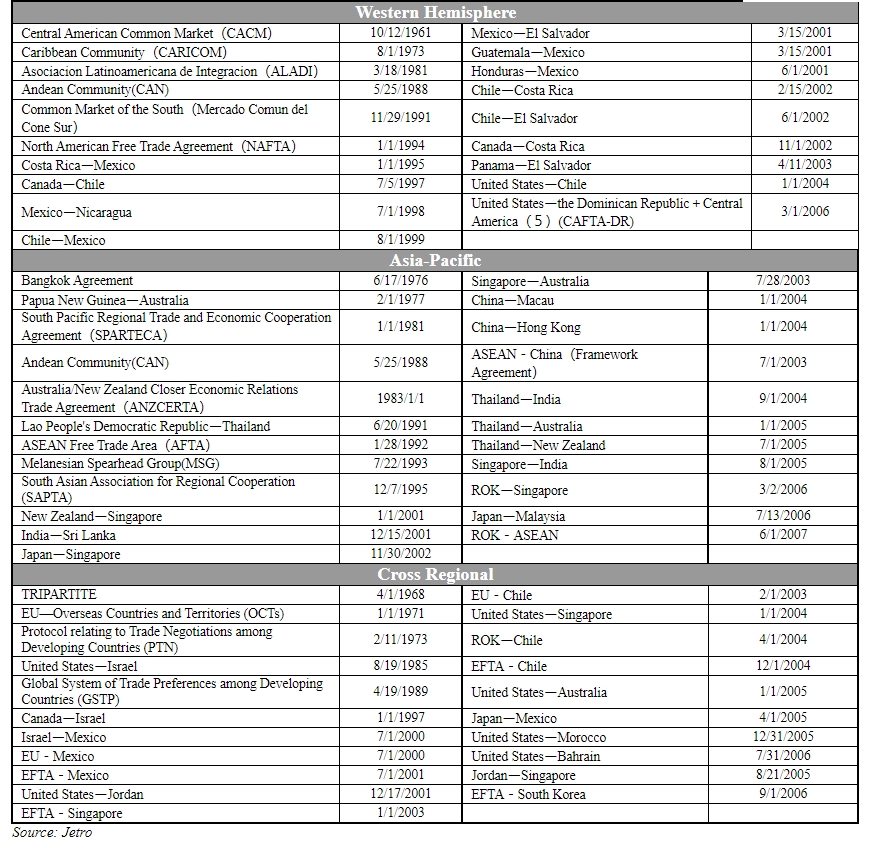
The Saudi apparel retail industry is one of the high-growth markets in the Arab region especially in the women and children segments.The apparel business grew rapidly over the last few years as people became more fashion-oriented. The growth in the sector is attributed to the high young population and increasing purchasing power in the backdrop of the recent economic boom.
Clothing style in Saudi Arabia
Considering the clothing style in Saudi Arabia, men mostly wear the traditional white thobes along with the red shemaghs. Women on the other hand, wear the black abayas and tarhas for everyday use. Despite the fact that all women wear the traditional abaya on top of their clothes, underneath the abaya, Western dress is most common. Western dress is adopted more by the younger Saudi generation outside of school. Non-Saudi adults usually wear the Western dress code.
The Saudi Arabian apparel market is heavily reliant on imports especially when it comes to fabric, cloth, accessories and ready-made Western style clothes. These imports come from all over the world depending on price range and quality. There is a noticeable distinction and a clear line between the high-end and low-end types of clothes. European and American clothes are usually classified as high-end and targeted towards the upper social class, whereas, garments imported from the Far East especially from China offers much lower prices and quality and is geared towards the lower social class, which represents the largest section of the pie. Saudi manufacturers, on the other hand, mainly supply military uniforms and traditional abayas.
In Saudi Arabia, Riyadh is currently the largest market for retail apparel in Saudi Arabia accounting for around 40% of total apparel sales, and is followed by Jeddah (around 30%) and Dammam/Khobar (around 20%).
The growing presence of international branded apparel in these big cities has contributed to growth in branded apparel sector. Jeddah is larger on the mid-tier segment due to the large number of pilgrims it receives during the Hajj and Umrah seasons, while Riyadh is more important for the top end of the market due to the presence of a larger base of wealthier consumers.
Dammam/Khobar comes in the third place, although it does gain some seasonal importance during Hajj and Umrah seasons when pilgrims coming from Bahrain and Kuwait stop over for shopping on their way back form the pilgrimage.
Market segments
The major market segments in retail apparel include womenswear, footwear, childrenswear and menswear.
Some segments of the market like womenswear are more developed whereas other segments are yet to catch up. Menswear represents a small segment of the ready-made clothing sector in comparison to womenswear and childrenswear.
Womenswear is the largest retail apparel segment in the Saudi market. Womenswear accounts for around half of the total branded retail sales, and is considered the most mature segment of fashion retail. In the Womenswear, casual and evening dress accounts for the major share.
Sales of childrenswear are high in Saudi Arabia due to the young population and the high birth rate. Childrenswear account for around 15% to 20% of total sales. The influence of global media on the young population (representing around half of the total population in Saudi Arabia) is also a driving factor. This segment is becoming more fashion-oriented and brand-conscious. In the childrenswear segment, babywear, newborn, and pre-natal clothing are all relatively under-penetrated.
Menswear is a minor segment in the Saudi fashion retail market accounting for less than 10% of total apparel sales. Men still prefer to wear the national traditional clothing at home, at work, and in public. With the majority of the Saudi population at a young age, a shift in consumer tastes may be the catalyst for the future growth in this segment.
Economic growth an important driver of retail sector
The oil boom led to the increase in government revenue and expenditure, which in turn boosted the economy. The impact of a healthy economy on clothing spending is notably positive. With higher levels of disposable income, and consumer confidence, Saudi consumers are spending more money, particularly on non-necessities such as mass market branded clothing.
Shopping malls a growth enabler
The construction boom of residential, commercial, and leisure projects, which has taken place all over the kingdom in the last few years, has led to the availability of large retail space. Openings of numerous shopping malls and the ease and convenience this has provided shoppers with has contributed to growth.
The Japan-Malaysia Economic Partnership Agreement (JMEPA) went into effect in July 2006.Prominent among the products imported by Japan from Malaysia are textile products. Japanese import tariffs are already at low levels on most items. Japan’s most favored nation (MFN) and generalized system of preferences (GSP) tariff rates on textile products are within the 0–14% range, with many items of apparel specifically being subject to rates of around 10%. As a result of the Japan-Malaysia EPA, almost all textile product items imported by Japan from Malaysia are not subject to tariffs.
An 80% share of textile imports by Japan come from China, where GSP or MFN tariff rates are applied. Malaysia therefore has an advantage relative to China with respect to tariffs, as well.
Japanese textile imports from Malaysia amounted to $142.61 million in 2006, which is only 0.5% of total textile imports. It appears, however, that the tariff benefits are being enjoyed since the Japan-Malaysia EPA went into effect. No marked increase has been apparent in apparel since the Japan-Malaysia EPA went into effect, but it is conceivable that the FTA will be utilized because of the large tariff advantage.
Rules of origin for textile products are subject to manufacturing process criteria. In principle, it is a condition that two processes be carried out in a signatory country or in an ASEAN member country.
The aim is more tangible – to grow Singapore’s share of the world apparel manufacturing business by 15 per cent over the next five years.
Singapore manufacturers already produce clothes for several high-profile global brands, including Gap, Zara, Armani and H&M, as well as American department stores Macy’s and Target.
The combined manufacturing output of Singapore’s 128 garment manufacturers was about $6 billion, or 2 per cent of global output, last year.
Trade and Industry Minister Lim Hng Kiang said at the launch of Apparel Singapore that the industry here had an edge over global rivals ‘by leveraging on the cost-effective manufacturing locations in (the region) and basing their headquarters (here)’.
But, he added that ‘global competition in apparel sourcing will intensify’, so Apparel Singapore will be introduced to the United States and Japan markets over the next six months.
Apparel Singapore will initially comprise nine Singapore-based manufacturers acting as brand ambassadors for the industry.
Asia Garment Manufacturer, Bodyknits International, Clovertex, Ghim Li Global, Gimmill Industrial, Lee Yin Knitting Factory, Ocean Sky International, SL Global and Teo Garments Corporation were chosen as they all own and manage many production sites in almost 20 countries.
The Textile and Fashion Federation of Singapore (TaFf) secretary-general Chris Koh expects the number of brand ambassadors to grow to ‘a pool of about 20 by next year’, and then grow at 10 to 15 per cent each year.
The acceptable technical deviations from the sizes indicated on the labels should not exceed 2% between 50 -71 cm and 1% for more than 71 cm. The label must be attached to the jacket or suit with the manufacturer’s name, trademark, size, material, country of origin and methods of caring.
PFOS shall not be placed on the EU market or used as a substance in preparations in a concentration equal to or higher than 0.005% of mass. It shall not be placed on the market in semi-finished goods or in parts of such goods if the concentration of PFOS is equal to or greater than 0.1% of mass.
For textiles or other coated materials, the amount of PFOS must be less than 1 ug/sq m of the coated material.
In addition, the bill adding PFOS into the Virtual Elimination List under the Canadian Environmental Protection Act passed the third reading in the Senate to become law in Canada.
The items covered by the hike include silk, wool yarn, chemical fiber and cotton products.
The country’s textile and clothing exports rose 11.1% to 81.7 billion U.S. dollars in the first half, but the growth rate was 6.4% points less than the same period last year.
Eligibility Criteria
Foreign Workers Recruitment in Malaysia
Eligibility Criteria
1. Export-oriented Companies
i. a minimum local content value of 40%; or
ii. a minimum value-added product of 30%; or
iii. a minimum capital investment per employee (CIPE) ratio exceeding RM100,000
The eligibility ratio of local workers vis-à-vis foreign workers is 1: 3.
2. Non-Export oriented Companies
i. a minimum local content value of 40%; or
ii. a minimum value-added product of 30%
The eligibility ratio of local workers vis-à-vis foreign workers is 1: 1.
Source Countries
Source countries approved to supply foreign workers in the manufacturing sector :
Philippines (male), Indonesia (female), Cambodia, Kazakhstan, Laos, Myanmar, Pakistan, Nepal, Sri Lanka, Thailand, Turkmenistan, Uzbekistan and Vietnam.
Levy
i. Levy imposed for foreign worker in the manufacturing sector is RM1,200 per worker per annum.
ii. Payment must be made in the form of bank draft to Director General of Immigration Department within 2 days after approval.
Certificate From The Human Resources Department to the effect that the employer has availed himself of the Job Clearing System (JSC) to recruit workers locally
i. The Job Clearing System (JCS) is a computer generated service that is handled by the HRD to assist job seekers in finding jobs and to assist employers in recruiting workers from among the locals.
ii. In order to obtain the Certificate of Registration, an employer must have advertised the relevant vacancy with the JCS either on-line or by calling at the nearest HRD office.
The HRD will issue a Letter Verifying Registration with JCS upon being satisfied either that the employer has through this service made every effort to recruit workers locally or that 30 days have elapsed since the employer’s registration with JCS.
Response to MKMA’s Memorandum on Foreign Workers Issues
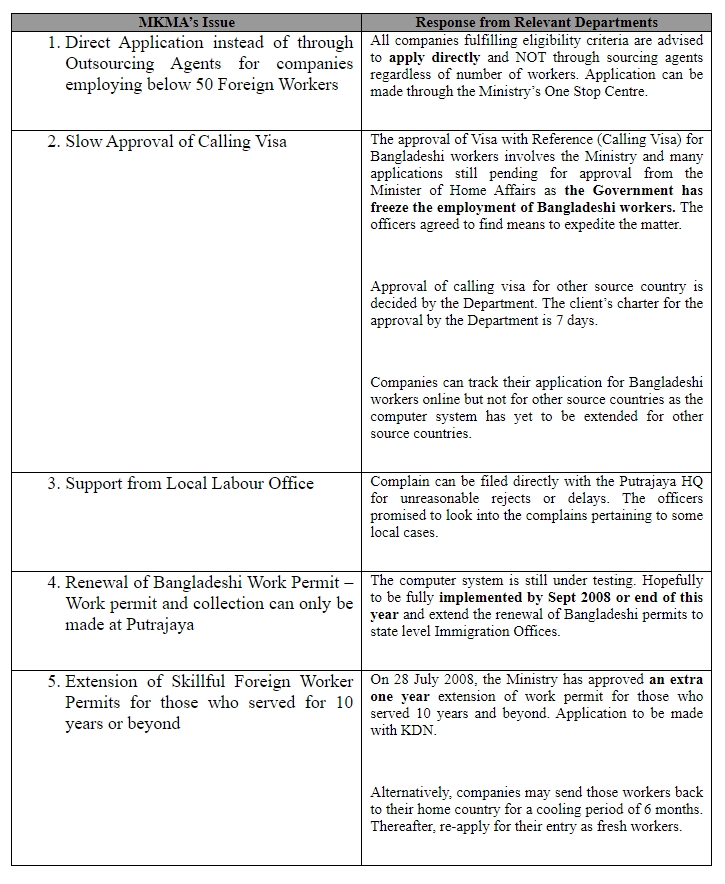
Prime Minister Datuk Seri Abdullah Ahmad Badawi announced that Bank Negara has set up two financing facilities of up to RM1.2 billion to help small and medium enterprises (SMEs) cope with the impact of higher costs due to rising prices. The RM700mil SME Assistance Facility and the SME Modernisation Facility with an allocation of RM500mil would commence on 1 August 2008.
Small and medium enterprises (SMEs) are an important segment of the Malaysian economy accounting for 99.2% of total business establishments, employing 56% of the work force and contributing about 32% of gross domestic product. To ensure that SMEs remain viable, the Government announced measures to assist SMEs to better manage the impact of higher costs on their operations.
SME ASSISTANCE FACILITY (RM700 million)
Bank Negara Malaysia has established a RM700 million SME Assistance Facility to assist viable SMEs that are facing financial difficulties to manage temporary cashflow problems due to the rising costs.
The Facility is intended to assist viable SMEs to continue operation and to preserve employment. However, the financing facility shall NOT be used to refinance existing credit facilities (inclusive of NPLs and pre-NPLs).
Under this Facility, viable SMEs will be able to obtain financing at 4% per annum from any commercial and Islamic banks, SME Bank, Agro Bank, Bank Rakyat and EXIM Bank, with an 80% guarantee coverage by the CGC and remaining 20% risk borne by the participating financial institutions.
The maximum amount of financing under the Facility is RM1.5 million per SME, with a maximum tenure of 5 years. Application for new financing under the Facility will be open for 2 years, commencing 1 August 2008.
SME MODERNISATION FACILITY (RM500 million)
Bank Negara Malaysia has established a RM500 million to provide financing to SMEs to modernise their operations, in particular to purchase or upgrade machinery and equipment, as well as for energy saving equipment.
Under this Facility, viable SMEs will be able to obtain financing at 4% per annum from any commercial and Islamic banks, SME Bank, Bank Rakyat and Agro Bank, with an 80% guarantee coverage by CGC and remaining 20% risk borne by the participating financial institutions.
The maximum amount of financing under the Facility is RM5 million per SME or up to 95% margin of financing, whichever is lower with a tenure of up to 8 years. Application for new financing under the Facility will be open for 2 years commencing 1 August 2008.
Eligibility Criteria
Application is to be made through all commercial banks, all Islamic banks, SME Bank, Agrobank, Bank Kerjasama Rakyat and EXIM Bank.
For further details, SMEs can approach the participating financial institutions or contact Bank Negara as below :
BNM TELELINK
Jabatan Komunikasi Korporat, Bank Negara Malaysia,
Jalan Dato’ Onn, 50480 Kuala Lumpur
Tel : 1-300-88-5465 Fax : 03-2174 1515 Email :bnmtelelink@bnm.gov.my
Japan External Trade Organization (JETRO) is a Japanese government-funded trade & investment promotion organization. JETRO has provided significant assistance to thousands of foreign companies, particularly small and medium-sized firms by conducting wide-ranging programs to promote trade and investment with the aim of stimulating both the East Asian and global economies.
To enhance the primary aims of strengthening trade and investment linkages with the Japanese market, Trade Tie-Up Promotion Program (TTPP) was launched. It provides an opportunity for exporters to advertise their products free on-line on JETRO website.
From 2007 onward, JETRO created “Special column for Malaysian exporters” for Malaysian companies who wish to display their exportable products. The registration for this corner is FREE OF CHARGE.
TTPP is an innovative, internet-based, business solutions system that helps businesses to find suitable partners by mediating between Japanese and overseas corporations. Lists of registered Japanese companies seeking contact with companies from other countries are available.
For addition information, please visit http://www.jetro.go.jp/ttppe/.
For the first time this year, U.S. consulting firm Jassin O’Rourke publishes its comparison of labor costs in apparel manufacturing countries. The study reveals that seven Asian countries are now offering lower labor costs than China. The study also offers a labor cost comparison within each region from Latin America to Eastern Europe and Africa-Middle East.
Bangladesh, Cambodia, Pakistan and Vietnam
According to the study, lowest labor costs are still in Bangladesh, at 22 US cents per hour or five times lower than in China’s richest coastal areas.
Labor costs include wages, social charges, and a series of bonuses. There may be very large differences in labor costs within a country as minimum wages may vary depending on economic zones.
In addition to Bangladesh, Cambodia, Pakistan and Vietnam are other apparel exporters taking advantage of extremely low labor costs at 33 cents, 37 cents and 38 cents per hour, respectively.
By contrast, China’s lowest labor costs are at 55 cents in the country’s inland and remote areas while labor costs may now reach US$1.08 in certain areas of coastal provinces. Labor costs in Haiti therefore are 50% below highest Chinese costs and at the same level than lowest labor costs in China.
US$ Slide Affecting Labor Costs
Labor costs were calculated in local currency terms before being converted in US$ terms. The US$ conversion strongly affects the results but makes sense as international prices are set in US dollars.
The yuan’s sharp rise since July 2005 obviously boosted China’s labor costs in apparel plants, for example. The dollar’s decline resulted in a 10% increase in US$ China costs in the 15 months between February 2007 and May 2008.
For the same reason, US$ costs were raised by 7.8% in India over the period and 9.2% in Thailand.
Labor costs are not the unique factor for sourcing decisions, as everyone is aware in the apparel business. Other factors include labor productivity (usually very high in China), quality and cost of available textile materials, energy prices, lead times, services offered to apparel importers or brands, import tariff rates in Europe or the United States, cost of freight, etc.
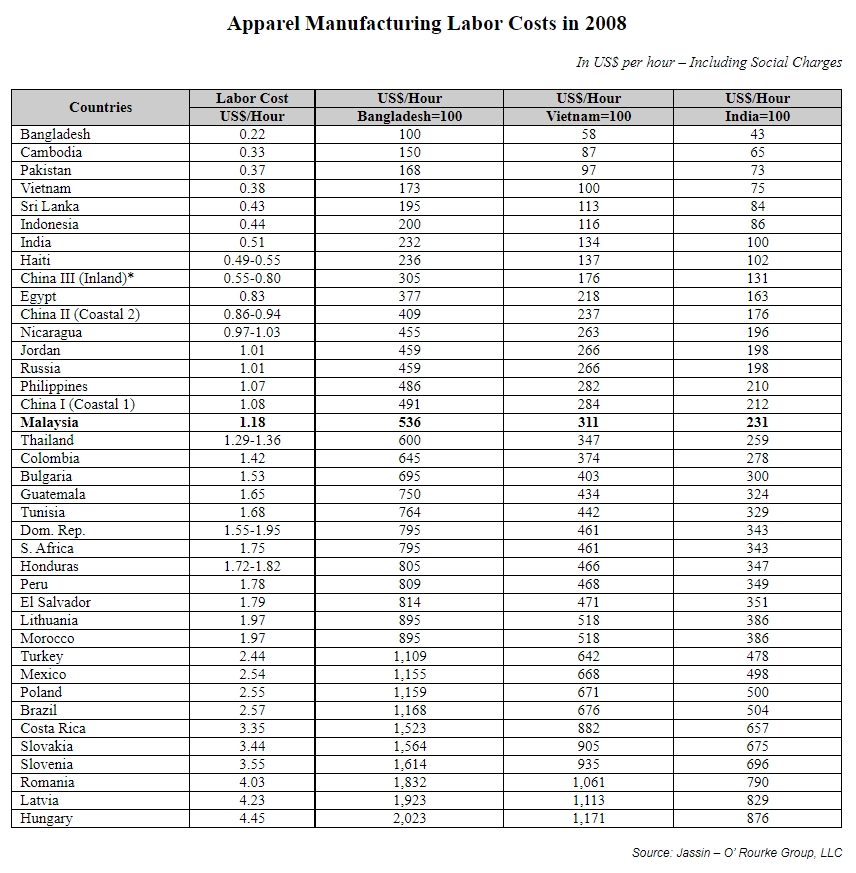
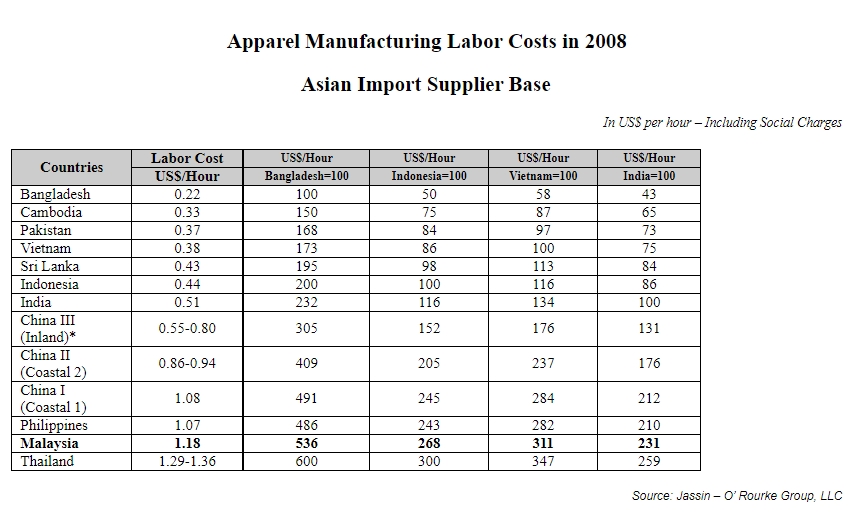
Objective
To assist viable SMEs that are constrained by non performing loans (NPLs) through Small Debt Restructuring Scheme (SDRS) by facilitating their request for loan restructuring and arranging for new financing, if necessary.
Scheme Mechanism
Under SDRS, the Small Debt Resolution Committee (SDRC) has been established to undertake an independent assessment on the viability of SMEs after their applications for debt restructuring together with request for new financing have been declined by participating financial institutions.
Maximum financing rate: 5% per annum
Maximum tenure: 5 years
Maximum financing: RM1.5 million per customer
Participating financial institutions / Implementing Ministry / Agency
Eligibility criteria
Purpose of financing
Working capital and business expansion purposes. The facility cannot be used to refinance the existing credit facilities.
Contact
SDRC Secretariat
Bank Negara Malaysia (BNM)
Tel: 03 – 2693 2330, 03 – 2691 6539 & 03 – 2691 3764
Website: www.bnm.gov.my
ERF Sdn Bhd
Tel: 03 – 2078 1378 Fax: 03 – 2072 1411
Website: www.erf.com.my
The ministry is currently undertaking steps to look into wages in the electronics and textile sectors. The wage council will conduct a nationwide inquiry by interviewing workers in these two industries and come up with recommendations.
A similar wage council had recently approved a minimum wage for private security guards of between RM250 to RM700 to help ease their burden.
Subramaniam said while the Government did not agree on the implementation of a minimum wage for all workers, it recognised that it is necessary to offer decent salaries as the country is losing its skilled employees to its competitors.
“We are losing our skilled workers to Singapore and the Middle East. We may end up losing even more so we must come up with attractive salaries as a way of persuading them to stay on.
“I have requested the Malaysian Employers’ Federation to come up with guidelines on what is the appropriate salary for workers in the different areas in the private sector and how to implement them,” he said.
He said the ministry is also taking steps to reduce the presence of foreign workers by at least 500,000 persons and is thinking of ways and means of accomplishing this without affecting businesses and the economy.
Malaysian Trades Union Congress (MTUC) president Syed Shahir Syed Mohamud said the union would continue to pressure the Government on the issue of minimum wage of RM900 monthly for all workers despite the setting up of the wage councils.
MTUC had submitted a memorandum to the Ministry on workers wage issue. Besides minimum wage, the memorandum also touched on issues such as unions and productivity-linked wage systems.
Production of textiles and clothing in this latest month sank -4.1% from a year ago, the steepest pace this year. But exports jumped 22.5% from twelve months ago, the briskest pace in over two years, rising to an unprecedented RM1.1 billion. This divergence also is reflected in year-to-date trends, as domestic production in the sector is up just 1.0%, while exports are 7.4% higher than the first seven months of last year. Long term, this divergence is unsustainable, as most output from the sector is destined for foreign markets and thereby a function of growth in foreign demand.
It is projected that 2008 exports will jump to a record RM11 billion. Domestic production may turn positive in coming months to return closer to parity with foreign demand.
Year-to-date exports are up 3.6% from the first six months of last year, rebounding from a comparable -5.3% contraction in 2007. Shipments have expanded from year-ago levels five of the last six months, climbing 6.1% in June to RM963.1 million.
While typically exports and production of textiles and apparel trend in step with one another, the improved performance of shipments out of the country over the last three months suggests production may expand mildly in coming months. The current pace projects 2008 Malaysian exports of textiles and apparel are likely to reverse last year’s decline and expand to approximately RM11 billion, second only to the 2006 record of RM11.23 billion.
The number of apparel suppliers shipping goods to the U.S. dropped precipitously in the year ending Oct. 31, falling more than 85 percent in the 12-month period.
There were 6,262 apparel suppliers actively sending shipments to the U.S. at the end of October, down from 43,653 a year earlier, according to a report being released by Panjiva Inc., a New York-based firm that helps brands evaluate factories.
The report, drawn from U.S. Customs and Border Protection data and other sources, illustrates an accelerating drop in the number of apparel suppliers. The supplier count fell to 22,099 in July, 16,969 in August, 11,513 in September and 6,262 in October, a decline of more than 70 per cent.
Josh Green, chief executive of Panjiva, said the numbers “paint a frightening picture of the state of the world’s suppliers”. 40 per cent of the suppliers still listed as active had seen year-on-year drops of 75 per cent or more in the volumes they were shipping to the US.
The percentage of active suppliers based in China and Hong Kong has remained steady at about 60 per cent – suggesting that the effects of the slowdown are being felt equally across the global clothing supply chain.
China had already been seeing some consolidation in the number of its export factories due to rising domestic costs, even before the US economic crisis worsened.
In China, government statistics estimate that at least 67,000 factories across all sectors closed during the first half of the year.
The credit crisis could be pushing some big apparel buyers to direct their orders to suppliers that they know well, to reduce risks of problems with fulfilment. It may be that the retailers are focusing on those suppliers with whom they’ve had a longer and closer relationship.
Panjiva also tracks what types of products a supplier ships, which materials it has used, what types of customers it serves (premium, mass, discount or niche), whether it is sending shipments to the U.S. in excess of its own capacity or whether its shipments to the U.S. suggest available capacity.
To extend the permits of foreign workers who have served for more than five years and deemed as skillful, an interview and certification process is needed. The Certification of Foreign Workers Skills is administered by the Jabatan Pembangunan Kemahiran (JPK), (Department of Skill Development).
Application for Foreign Workers Skills Certification must be made ONLINE via the following procedures:-
Jabatan Pembangunan Kemahiran (JPK)
Kementerian Sumber Manusia
Aras 7 & 8, Blok D4, Parcel D
Pusat Pentadbiran Kerajaan Persekutuan, 62530 Putrajaya.
Tel : 03-88865400 Fax : 03-88892423
Companies are encouraged to make direct application with JPK for Certification of Foreign Workers Skills instead of paying a higher fee and applying through agents. No matter applying directly or through agents, the foreign workers still have to undergone the simple interview process. For foreign workers who do not speak Bahasa Malaysia, interpretation is allowed.
The GSP scheme
The GSP is an autonomous trade arrangement through which the EU provides non-reciprocal preferential access to the EU market to 176 developing countries and territories, in the form of reduced tariffs for their goods when entering the EU market. It is applicable for a period of three years at a time.
Tariff preferences on the EU market enable Developing Countries to generate additional export revenue to support implementation of their own sustainable development and poverty reduction policy strategies.
There has been a significant increase in recent years in the value of preferential imports
under GSP. Imports under the scheme totaled €51 billion in 2006 (an increase of 10% over 2005) and €57 billion in 2007 (an increase of 12% over 2006). Imports from LDCs increased by 35% in 2006 and then remained broadly stable in 2007.
The new GSP Regulation for 2009-11
With the current three-year phase of GSP set to expire at the end of 2008, a new GSP scheme has been adopted by the EU Commission for the period from 1 January 2009 to 31 December 2011.
Under the new GSP scheme, Malaysian export of textile and apparels to EU will still be entitled for duty preference. Exporters can check the information and the duty rates from EU Taxation and Customs website as below :
http://ec.europa.eu/taxation_customs/dds/cgi-bin/tarchap?Lang=EN
Graduation and De-graduation
Whenever an individual country’s performance on the EU market over a three-year period exceeds or falls below a set threshold, preferential tariffs are either suspended or reestablished. Graduation is triggered when a country becomes competitive in one or more product groups and is therefore considered no longer to be in need of the preferential tariff rates.
As a result of the re-calculations made on trade data for the period 2004-06, GSP preferences will be re-established for six countries and suspended for one, in the following beneficiary country and product group combinations:
De-graduation (re-establishment of preferences):
Graduation (suspension of preferences):
The net effect of these adjustments is worth at least €160 million to beneficiary countries in terms of import duties that would otherwise be imposed.
US Congress enacted the Consumer Product Safety Improvement Act of 2008. Although children’s products were the impetus for the Act, it affects all consumer products.
The Act addresses general conformity certification for all regulated consumer products, expedited rulemaking and enhanced penalties for noncompliance. That means manufacturers, importers, distributors and retailers must now meet higher product safety standards.
Who Should Test?
Beginning Nov. 12, every importer of a regulated consumer product will be required to supply a certificate showing that the product has been tested, and that it complies with the applicable regulations. Children’s products must be tested by certain accredited third-party testing facilities.
A certificate is required, however, only for those consumer products whose manufacture is guided in some way by a rule, ban, standard or regulation under any act enforced by the Consumer Product Safety Commission (CPSC).
Generally, a consumer product is any product produced or distributed for sale to a consumer for use in the home, at school, or for recreation, and governed by the CPSC.
There are more than 15,000 consumer products over which the CPSC has jurisdiction, but only about 280 categories of regulated products. Still, there are a large number of regulated consumer products, ranging from antennas to wearing apparel.
For children’s products, Congress set a schedule under which all certification must eventually be based on third-party testing.
Who should supply the certificate?
The Commission determined that for imported products, only the importer needs to issue the conformity certificate. This certificate must be available to the Commission no later than the time when the product or shipment is available for inspection in the United States.
Foreign manufacturers and private labelers of imported products do not need to issue certificates, and they do not need to be listed as parties on certificates.
Availability of Certificates
A copy of the certificate must be “furnished to each distributor or retailer of the product” (no requirement to provide to ultimate consumer). However, the certificate not necessarily a paper copy. Besides, a copy of the certificate must be made available to the Commission and Customs upon request.
Content of Certificates
The requirements for the general conformity certificate are fairly straightforward: It must certify that the consumer product complies with the applicable regulations based upon a test of the product, or upon a reasonable testing program. Each certificate must specifically identify the particular rule, ban, standard or regulation that applies to that product as well as the manufacturer, importer or private labeler issuing the certification.
The general conformity certificate must include the date and place where the product was tested and the name, address and telephone number of the individual responsible for maintaining records of the test results. The certificate must be in English—though it may also include the same content in another language—and accompany the product or shipment and be furnished to the distributor or retailer.
Handling of Certificates at the Ports
There is currently no requirement to file a certificate with CBP or any government agency as part of the entry process. Release of the shipment does not depend on presentation of the certificate. In future, the Commission, after consultation with CBP, may by rule provide for electronic filing of certificates up to 24 hours before arrival.
For details, please browse http://www.cpsc.gov/ABOUT/Cpsia/conformity.pdf or click here.
The US Consumer Product Safety Commission (CPSC) announced on September 16, the imposition of new regulation on the textile and garment products imported to the US market.
The law comprises numerous regulations which will come into effect at different points of time. In accordance with this new law, all textile and garment products exported to the US market will have to adhere to the norms defined, starting from February 2009.
The commission has assured to pay strict attention to product safety regulations and has noted that unlike the earlier practice of re-exporting products found violating safety rules, the CPSC would now have the right to destroy these products completely. Additionally, enterprises found guilty of breaching the regulations would be fined US $15 million which is much higher than the punitive charges imposed earlier. Increase in the number of infringements reported in the past 18 months has been one of the major reasons behind evolving an even more stringent regulation. This would ensure that the demand of importers for quality textile and garment products is effectively met.
Moreover, the new law lays substantial stress on safety regulations for baby clothes. This includes supervision on not only the kind of fabric used but also on the quality of ribbons and other decorative add-ons. The new law has also completely banned export of clothes with cord to the US. Goods meant for exports to the US would be deemed safe only upon recognition by an organization or a laboratory acknowledged by the US International Laboratory Accreditation Cooperation.
Better reflecting fading shipments to Malaysia’s largest foreign textile and apparel market, August exports fell at the steepest pace in months, more closely following the trend in textile and apparel production.Changes in exports and output returned closer to parity with one another in August, as shipments fell -5.6% from twelve months earlier to just over RM1.0 billion, the steepest decline in five months. This decline slowed the year-to-date growth to 3.5% from the first eight months of last year. The drop more closely tracks the -10.2% fall in August production of textiles and apparel, the fifth straight month of eroding output.
These declines pull the year-to-date output in the sector down -0.6% from the same period last year. Long term, the divergence this year between higher exports and slightly lower output is unsustainable, as most output from the sector is destined for foreign markets and thereby a function of growth in foreign demand.
Under the Third Thrust of the Malaysia Second Stimulus Packages as announced by YAB Dato’ Sri Najib Tun Abdul Razak on 10 March 2009, the Government launched the following Guarantee Scheme Facilities to assist private companies to weather the financial crisis.SME Assistance Guarantee Scheme
Eligible SMEs can obtain financing of up to RM500,000 per SME. The Credit Guarantee Corporation Berhad (CGC) will provide an 80% guarantee cover for financing approved. The guarantee cover will be provided free of charge and the cost of the guarantee will be fully borne by Bank Negara Malaysia. Financing obtained under this Scheme is for new financing only and must be used for business purposes, such as working capital, project financing and capital expenditure.
Key Features of the SME Assistance Guarantee Scheme (SME AGS)
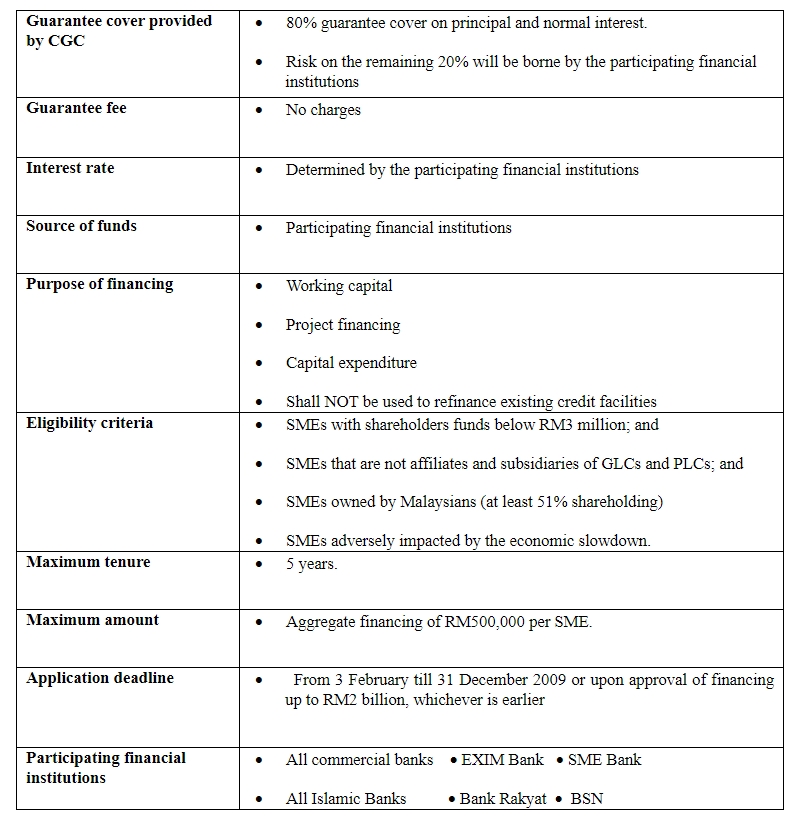
Working Capital Guarantee Scheme (WCGS)
The Working Capital Guarantee Scheme totalling RM5 billion will provide working capital to companies with shareholder equity below RM20 million. The Government will provide guarantee in the ratio of 80:20. The maximum loan amount will be RM10 million.
Industry Restructuring Loan Guarantee Scheme (IRLGS)
The Industry Restructuring Guarantee Fund Scheme totalling RM5 billion for loans to increase productivity and value-added activities. For companies with shareholder equity less than RM20 million, the Government will provide a guarantee based on the ratio of 80:20. For companies with shareholder equity of RM20 million or more, the guarantee ratio will be 50:50. The maximum loan is RM50 million.
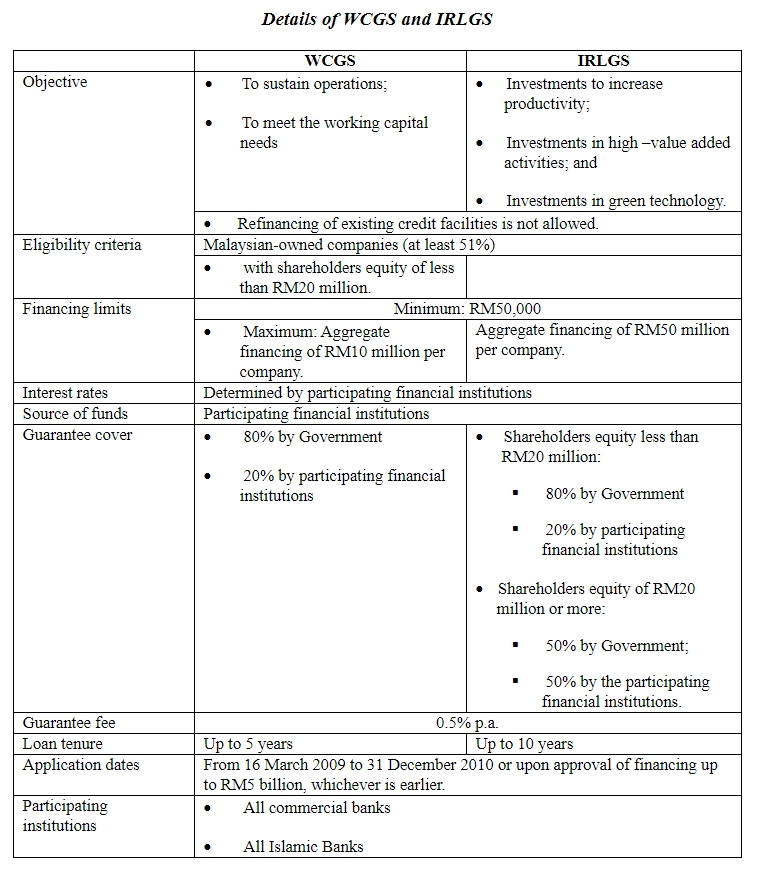
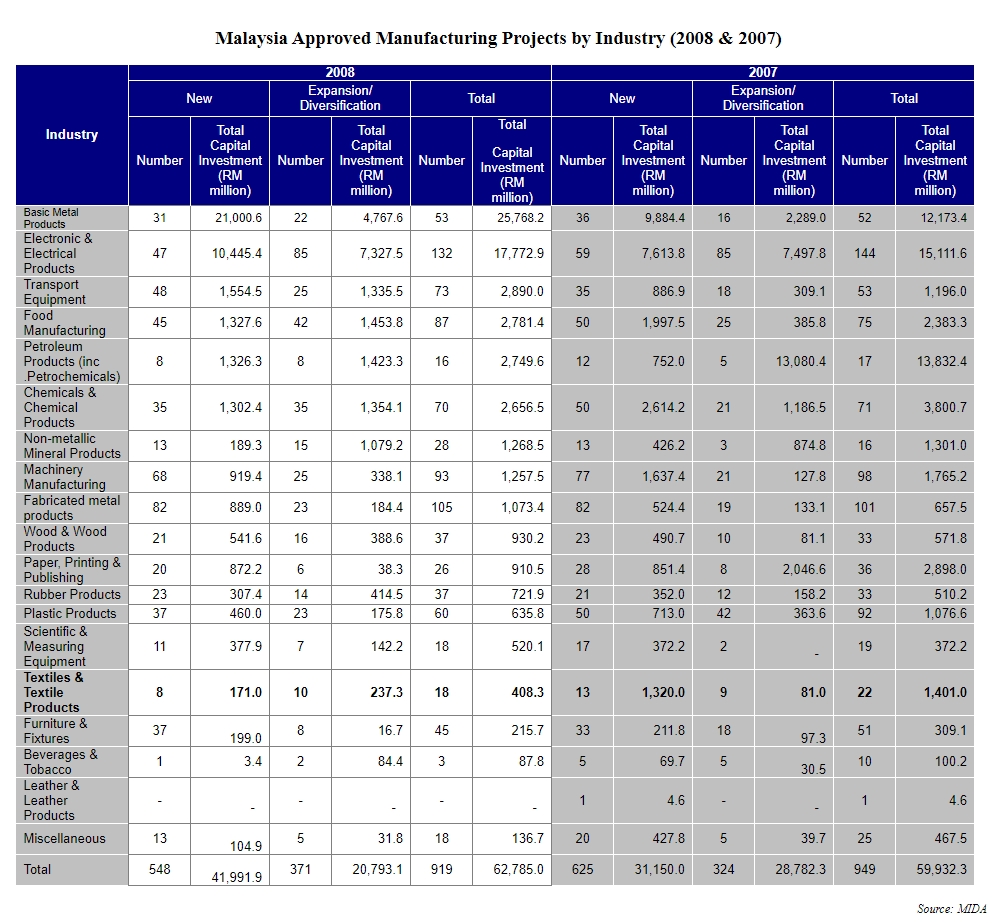
The landmark twelve countries Agreement establishing the ASEAN – Australia – New Zealand Free Trade Area (AANZFTA Agreement) was signed on 27 February 2009 at Thailand.The signing comes exactly six months after the conclusion of negotiations on 28 August 2008.
The AANZFTA Agreement is the first region-to-region free trade agreement for both ASEAN and, Australia and New Zealand. It is ASEAN fourth free trade agreement with dialogue partners (after China, Korea and Japan) and it is the first that Australia and New Zealand have jointly negotiated with other countries.
Through the AANZFTA Agreement, ASEAN, Australia and New Zealand effectively create a free trade area of over 600 million people with a combined GDP which is expected to have reached US$ 2.7 trillion, according to the IMF forecast for 2008. Intra-regional (ASEAN, Australia and New Zealand) trade has been growing an average of about 16 per cent per annum since the start of the FTA negotiations in 2005.
Taken together, Australia and New Zealand comprise ASEAN sixth largest trading partner. ASEAN as a group is the second and the third largest trading partner of Australia and New Zealand, respectively.
The AANZFTA Agreement will enter into force sixty (60) days after Australia and New Zealand, and at least four (4) ASEAN Member States have notified completion of their ratification processes.
Get Ready to Take Advantage of the Opportunities under AANZFTA
Malaysian companies should get prepared for the AANZFTA, which is expected to take effect from early next year. Companies should be active and creative in exploring the new opportunities the region-wide agreement would bring.
The AANZFTA Agreement opens a plethora of new opportunities for businesses located in the region. In addition to new market access, the Agreement provides greater transparency and certainty for companies doing business in the region. The deal would benefit Malaysian companies, especially exporters of consumer products including food, textile, footwear and furniture. The pact would reduce or lift most tariffs when it comes into force.
Employers can heave a sigh of relief. The mandatory induction course for maids and foreign workers to qualify for visas to come to Malaysia has been put off.The introduction of the course would have raised the fee the employers will have to pay and caused a “bottleneck” in the inflow of foreign workers.
The course was to have been made mandatory from May 1 for workers arriving from 10 source countries. Among the countries are Indonesia, Vietnam, Cambodia, the Philippines and Sri Lanka.
Human Resources Minister Datuk Dr S. Subramaniam said the launch had been temporarily shelved as the mechanism to implement it was not in place which includes the training module involved.
The Government had proposed the induction course for foreign workers to enable them to learn about Malaysia’s laws and culture. The duration of the courses ranged from a day to 60 hours. Upon completion of the course, the workers would get a certificate of eligibility to apply for a visa to work in the country.
Dr Subramaniam said induction courses had been conducted in some source countries like Bangladesh and Vietnam although it was not a requirement for the visa.
Overall, EU textile and clothing imports rose in value by just 0.2% in 2008, reaching Euro80.46 bn (US$117.65 bn). However, the overall figure conceals the fact that clothing imports alone were up by 2.4% in value while textile imports declined by 5.7%.In volume terms, the trends were similar as textile and clothing imports as a whole fell by 2.9% but clothing imports rose by 2.8% while textile imports fell by 6.7%. In the first three months of 2009, reflecting the worsening economic situation, textile and clothing imports fell by 1.7% in value terms and by 11.9% in volume.
Prices rose in 2008, despite an increase in the availability of supplies following the removal of safeguard quotas against China at the end of the previous year. Some suppliers increased their prices in order to maintain revenues in the face of falling sales volumes as the global financial crisis took hold. However, many suppliers have been moving to higher value products.
Eight of the ten largest textile and clothing suppliers to the EU raised their prices in 2008. Among these, the average price of imports from Vietnam rose by a significant 49%. However, this was exceptional, and other increases were more moderate.
In the first three months of 2009, all of the ten largest suppliers raised their prices at a time when volumes were declining. EU imports of Chinese dresses, pullovers, trousers, T-shirts and women’s blouses—which had been subject to safeguard quotas from mid-2005 to the end of 2007—rose in volume at double and triple digit rates in 2008, while the average prices of these imports fell at double digit rates. In contrast, imports of these items from Vietnam all fell sharply in volume but surged in price.
Last year, Malaysia registered total investment of RM62.8 billion in the manufacturing sector. The amount of investment for the first five months of this year only totals RM9.0 billion, as we are now experiencing the full repercussions of the global crisis. In fact, domestic investment (53.5%), accounted for a more substantial portion of the approved investment.In response to the global economic slowdown, one of the measures MITI undertook was the decision to implement automatic issuance of manufacturing licenses granted under the Industrial Coordination Act (ICA) 1975, to facilitate manufacturers in undertaking projects. As of 17 July 2009, a total of 116 companies have been approved manufacturing license under this new procedure. These include:
Recently the Government has also responded to the request especially by the E&E and textile and apparel industries for the employment of foreign workers, to enable companies to meet increased export demands.
Beyond preparing for the economic recovery, the Government has announced its intention to formulate a new economic model that focuses on achieving high per capita income and a high proportion of the income benefiting Malaysian companies and the workforce.
Allow me now to highlight the current performance of this Session’s four industry sectors:
Electrical and Electronic Industry (E&E)
E&E continues to be Malaysia’s leading industry and largest export revenue earner. This sector experienced a modest growth in 2008 due to slower demand for E&E products in major market such as the US, Europe and Japan. For the first five months of 2009, exports decreased 23.5% and imports decreased 27.4% to RM205.4 billion and RM155.3 billion respectively. Major factors contributing to the slowdown in exports included reduction in orders and cancellation of order renewals, downward pressure on consumer electronics prices that depresses orders and weaker consumer spending in the USA, Japan and Europe as a result of the crisis.
In terms of investments in the sector, 56 projects were approved with total investments of RM1.4 billion for the period January to May 2009. The industry is showing signs of revival, as exemplified by the increased export orders.
Petrochemical, Chemical and Pharmaceutical Industries
The petrochemical and chemical industry is the second largest contributor to our total exports. For the period of January to May 2009, export of petroleum products amounted to RM997.4 million, while imports reached RM381.6 million. For the chemicals and chemical product sub-sector, imports and exports totaled RM12.7 billion and RM12.3 billion respectively. During the first five months of 2009, total investments in petroleum products (including petrochemicals) totaled RM1.1 billion, while that for chemical and chemical products amounted to RM1.5 billion.
The pharmaceutical industry, which is mostly dominated by SMEs, saw an increasing demand trend in the domestic market. The pharmaceutical industry productivity in 2008 grew by 11.6 per cent, while sales value expanded by 11 per cent to RM1.4 billion. This increase is due to demand from the domestic market, arising from better health awareness and ageing population. Manufacturers must continue to expand and upgrade their existing facilities to meet the rising local and overseas demand for generic OTC drugs and food supplement drugs, specialist therapy and medical tourism.
Rubber Products Industry
Last year was a challenging period for the rubber products industry due to volatility of rubber and oil prices that contributed to uncertainty in the cost of manufacturing. Currently, for the period January to May 2009, exports of rubber products amounted to RM4.9 billion, a decrease of 4.4 per cent, compared with RM5.1 billion for the corresponding period in 2008 while imports decreased 0.7 per cent to RM1.1 billion. During the same period, total investments was RM52.1 million, comprising RM31.7 million of foreign investments and RM20.4 million of domestic investments.
The Government recognizes that R&D in upstream, midstream and downstream segments are vital to push the industry ahead. The private sector needs to seriously pursue research efforts to enhance improvements in capacity, capability and knowledge of the industry.
Textile and Apparel Industry
For the period of January to May 2009, exports amounted to RM3.48 billion. Main export items include men’s and women’s clothing valued at RM2.7 billion and woven fabrics valued at RM1.3 billion. During the same period total investments in the textile and apparel industry was RM36.7 million.
In 2008, the government announced a reduction of import duty for 32 lines on textiles and accessories from a range of 30%-20% to 10%-20%. This measure is meant to enhance the competitiveness of the industry. During the same year, the Malaysian Textile and Apparel Centre (MATAC) also trained 360 students or 9% of total number of students in textiles courses.
The declining trend in industrial output since the fourth quarter 2008 due to decreasing demand in the export-oriented industries is expected to continue into this year for many industries. While the pharmaceutical, healthcare and medical devices sector is expected to face less impact from the crisis, the petroleum products and petrochemicals and plastics product sector, the basic industrial chemicals, textiles and apparel and cement industry you represent can expect to continue to face a difficult business environment. Nevertheless, prospects for the recovery of manufacturing sector are expected to improve in 2010.
The textiles and apparel industry consists of four segments, namely primary textiles (polymerization, spinning, weaving, knitting and wet processing), made-up textiles, textiles and clothing accessories, and made-up garments. A total of 662 major companies are involved in the four segments of the industry, while approximately 1,000 SMEs are mainly in made up garments manufacturing.
Production
In 2008, the production index of the textiles segment increased by 8.6% to 102.8 from 94.7 in 2007, while the production of the apparel segment decreased by 9.5% to 102.5 from 113.3. The major decline was in man-made fibre spinning and weaving of textiles, which decreased by 30.7%.
Production Index of the Textiles and Apparel Industry (2005=100)
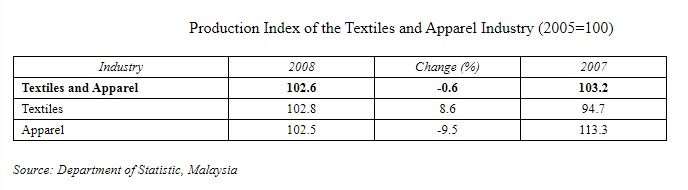
Factors which contributed to the overall slowdown in the industry production:
Ø Closure of three major textile producers at the end of 2007, which resulted in a loss of total annual production of about 8 million kg of yarns and 25 million metres of woven fabrics, equivalent to a reduction of 35% of the total production of primary textiles.
Ø Economic slowdown in the USA resulted in a decline in demand, as the USA was Malaysia’s major export destination for the industry in particular, the apparel segment.
Sales
In 2008, sales of the textiles segment increased by 4.5% to RM4.6 biliion from RM4.5 billion in 2007, while sales in the apparel segment decreased by 9% to RM2.8 billion from RM3.1 billion. In addition to the economic slowdown in the USA which resulted in reduced consumer purchasing power, the continuing increases in the costs of doing business due to higher prices of fuel, raw materials, utility charges and freight charges, also contributed to the drop in sales.
Sales of Textiles and Apparel Products
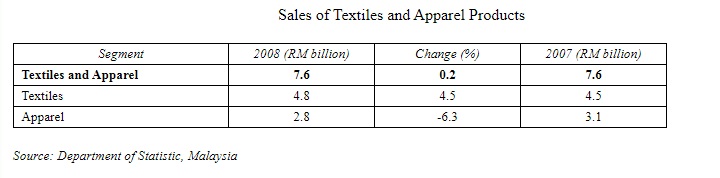
Employment
Employment in the textiles and apparel industry declined by 14.3% to 53,071 in 2008, compared with 61,954 in 2007.
Employment in the Textiles and Apparel Industry
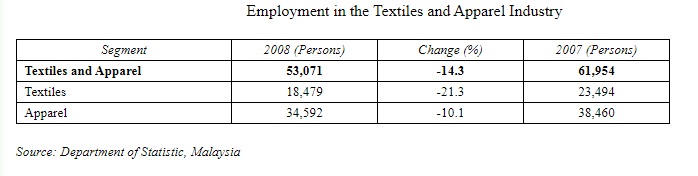
Productivity
The textiles and apparel industry registered an increased in productivity of 2.6% to RM24,100 in 2008, compared with RM23,400 in 2007. The industry recorded an improvement in labour cost competitiveness, reflected by a decline of 1.3% in Unit Labour Cost, while Labour Cost per Employee increased by 1.5%.
Productivity indicators for Textiles and Apparel Industry
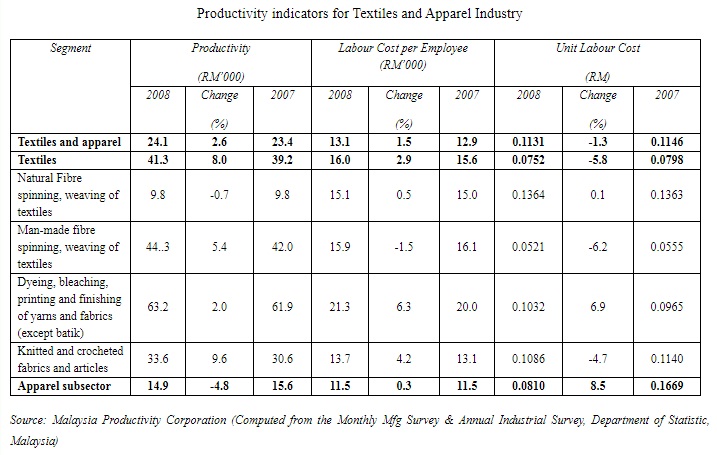
Investment
In 2008, approved total investments decreased by 70.8% to RM408.4 million, compared with RM1.4billion in 2007. Domestic investments accounted for RM105.4 million, while foreign investments accounted for RM303 million. A total of 18 projects were approved in 2008, compared with 22 in 2007. Seven projects were approved in growth areas such as the production of integrated textile products (RM289.7 million) and man-made staple fibres (RM54.1 million). Major sources of investments were Germany with a value of RM102.4 million and the USA (RM82.1 million).
Investments in the Textiles and Apparel Industry
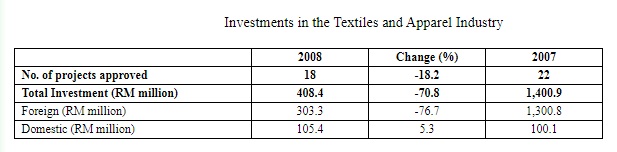
Exports
Exports of textiles and apparel products grew by 2.7% and 1.9% respectively in 2008 and accounted for RM10.5 billion of total exports. The growth was mainly due to the stronger US Dollar.
In 2008, exports to the USA and Turkey recorded declines. Exports to the USA, valued at RM2.5 billion, registered with a drop of 7.8% compared with RM2.7 billion in 2007, while exports to Turkey declined to RM732.9 million from RM748.7 million in 2007. Main export items were men and women clothing valued at RM2.7 billion, textile yarns (RM2.3 billion) and woven fabrics (RM1.3 billion).
Exports of Textiles and Apparel Products
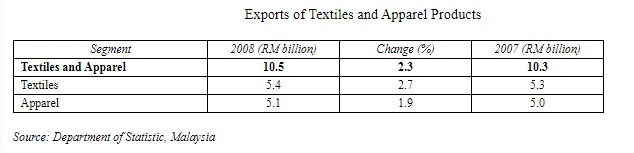
Imports
Imports of textiles and apparel products decreased by 3.3% in 2008 to RM5.5 billion, compared with RM5.7 billion in 2007. The growth in imports was mainly due to the outsourcing of both textiles and apparel activities to more cost competitive countries such as Vietnam, the People’s Republic of China and Cambodia.
Major sources of imports in 2008 were the People’s Republic of China with imports valued at RM2 billion or 37.4% of total imports of textiles and apparel, followed by Taiwan (RM489.2 million); Thailand (RM412.1 million); Indonesia (RM396.6 million) and Hong Kong S.A.R (RM298.1 million).
Imports of Textiles and Apparel Products
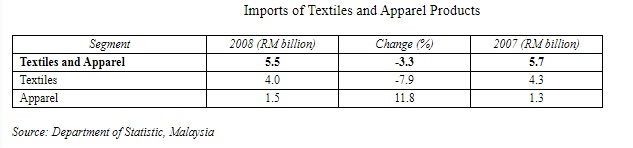
The Pakistani government on 12 August 2009 announced the first ever five-year Textile Policy 2009-14 which offers about Rs87 billion cash subsidy to the textile and clothing sector to boost exports. It envisages plans to boost textile exports to $25 billion from the current $17.8 billion by 2014.
The textile policy 2009-14 providing incentives of export refinance at lower rates, relief on existing long-term loans, restructuring and reorganisation of the textile sector, drawback of local taxes, refund of past R&D claims etc. The policy also exempts the textile industry from load shedding and allows it prioritised gas supply.
The government has also subsidised the export refinance with a reduced rate of 5 percent and Rs 2.5 billion allocation. The policy allocates Rs 5 billion relief on the existing long-term loans of the textile industry.
All textile machinery imports will be zero-rated to encourage new investments. Support will be provided for setting up effluent treatment plants for the existing industry.
Duty Drawbacks
An amount of Rs44 billion as special drawback rates will be provided to value-added textile exports for two years. For this purpose following drawback scheme is proposed:
Export House Scheme:
To initiate a process of building big export houses, Government is planning to treat local sales of yarn and fabrics to large exporter as deemed exports. For this purpose, small producers will get 1% drawback on levies and unadjusted taxes on sales to the export houses.
Capital Intensive Projects
Under UTF for capital intensive projects, the government will bear 50% of interest cost of new investment in plant and machinery with a maximum of 5%. For small investments, government will contribute up to 20% of capital cost as a grant.
The statistics are staggering. China and India are currently the third and fifth largest economies in purchasing power parity, respectively. Some forecasts suggest that by 2020, China and India will pass Japan’s GDP in purchasing power parity and that by 2050 China will be the leading economy of the world followed by the United States and India. Four hundred of the Fortune 500 firms now operate in China, while 220 of the top 500 operate in India. In 2005, China alone attracted about $1 billion per week in foreign direct investment.
In three decades, China has lifted 400 million people out of poverty, a feat no other country has performed. The pent-up demand for consumer goods is making China and India the hottest markets for everything from automobiles and cell phones to fashion goods and entertainment. This remarkable economic resurgence and the future promise of China and India have made entering these markets critical to the survival and success of many firms.
Country Comparison
Economy. China relies mainly on its manufacturing base while India relies on the software and IT-related service industry. China’s competitive advantage still largely rests on its cheap labor. India’s competitive advantage rests on its English-speaking, educated workforce. China’s growth is fueled by foreign direct investments, while India relies more on domestic savings.
Demographics. China has the largest population in the world while India has a younger population. For decades Chinese families were shackled with a one-child-only policy. This led to a curb on population growth but has resulted in a population distribution that is older than that of India. The distribution of the Indian population is skewed toward youth with most of it below 35 years of age. The bulk of India’s younger population is in the poorer and less educated parts of the country, however.
Investor Friendliness. China scores significantly higher than India on investor friendliness. China can efficiently consolidate and synchronize the implementation of nationwide policies.
Unlike China, India has not had this lock-step approach to attracting foreign capital. The federal government and state governments can often be at loggerheads on any policy issue. For example, foreign investors who have been cleared to enter India at the federal level may find local governments lukewarm or even opposed to their arrival. The nexus between political leaders, bureaucrats, and local business leaders who fear foreign competition is another deterrent to foreign investment. Thus India has been comparatively slow in attracting foreign investment. Consequently, the economic openness and investment friendliness of India is not as impressive as that of China.
Implications for Success
Given these significant differences between China and India, we can draw a number of implications for firms entering and operating in the two countries.
Market Entry. Given the fact that government at all levels encourages foreign direct investments, entry into the Chinese market is not a difficult task as long as the foreign business obtains government support. The difficulties lie at more tactical entry issues, such as location, timing, scale, and so on. Entry into India requires more careful consideration because federal and local governments may differ on their policies toward foreign investments.
In both countries, entry strategies that involve high control (e.g., wholly owned subsidiaries) are more successful than those that involve low control (e.g., licensing). For example, FedEx, which operates as a wholly owned subsidiary in China, is more successful than UPS, which operates as a joint venture.
Familiarity with a similar economy and culture is useful when entering China. For example, the Southeast Asian agribusiness conglomerate from Thailand, Charoen Pokphand Group, is more successful in China than the ag-based firm of North American, Seagram. Surprisingly, even after several decades of international experience, many western firms tend to impose western consumption habits and production methods in emerging markets.
Market Development. The Chinese market can be easily segmented by geography as its eastern coastal provinces are more economically developed and contain much of its affluent urban consumers. India lends itself to a richer segmentation scheme with income, urbanization, religion, education, lifestyle, and social strata as useful segmentation variables.
Targeting decision in China and India are fairly straightforward. In China, the four major cities Beijing, Shanghai, Guangzhou, and Chengdu are the four regional economic epicenters. Major brands should target these four cities when they first enter China. India’s five major cities, Mumbai, Bangalore, Chennai, Dehli, and Kolkata are the economic hotspots.
Regarding product positioning, western brands can comfortably position themselves as global brands, as Chinese and Indian customers consider these brands aspirational. However, western brands need to make sure the translations of their brand names, logos, and slogans are appropriate, especially in the Chinese language and cultural environment.
Pricing strategies follow from the product strategies. For both China and India, the price and quality association is rather strong, and western brands are perceived to be more expensive as their quality is perceived to be higher. However, Chinese and Indian consumers are very discerning and carefully weigh costs with benefits. Therefore, firms should rethink their business models; they must rely on low-cost business models to be able to price products within the reach of the customer’s buying power. For example, localizing operations quickly rather than relying on expatriate managers can reduce costs.
In summary, both China and India are rising economic powers. Their emergence onto the world stage is profoundly transforming the global economy in almost every aspect. These two countries offer great growth opportunities and earning potential.
The Government on 17 July 2009 has agreed to uplift the freeze on foreign workers in the electrical, electronics (E&E) and textiles and apparel sub-sectors. However, the freeze on Bangladeshi would remain.
With this decision, employers in these sub-sectors are allowed to recruit foreign workers, subject to the current ratio of local workers to foreign workers of 2:1 for E & E companies and 1:3 for export-oriented textiles and apparel companies.
Deputy Prime Minister Tan Sri Muhyiddin Yassin said the committee had also agreed that foreign workers, except for domestic maids, would NOT be allowed to remain in the country for more than five years.
“They can re-apply for an extension of their work permits, but they will have to go home first.”
Besides, according to Datuk Ismail Abdul Rahim, Director General of the Labour Department, NO levy deduction would be allowed for new employees registered after April 1. The rationale to get employers to bear the levy is to discourage them from employing foreigners.
Applications for foreign workers can be submitted to One Stop Centre (OSC), Foreign Worker Division, Ministry of Home Affairs at:
Bahagian Pengurusan Pekerja Asing,
Kementerian Dalam Negeri,
Aras 4, Blok 2G4 (PODIUM), Percint 2, Pusat Pentadbiran Kerajaan Persekutuan, Putrajaya
GL : 603-8880 1343 Fax : 603-8880 1324 Website : www.moha.gov.my
The US Consumer Product Safety Commission (CPSC) has published guidelines for compliance with its new tracking label requirement for products, including textils and apparel, intended for use by children.The recently enacted Consumer Product Safety Improvement Act (CPSIA) requires manufacturers of children’s products to have permanent distinguishing marks on their products and packaging that will identify the location and date of production and batch number of a product in order to make it easier to track possible safety problems and determine whether the product may be subject to a recall.
The CPSC guidelines say that if a manufacturer can identify the location, date of production and batch number of products or components, it can more easily isolate products that it or others may say presents a safety concern. In enacting the CPSIA regulation, Congress said it was addressing difficulties some manufacturers of children’s products and consumers have been experiencing in determining if a product or its components may be subject to recall. CPSC says the labeling requirement is not a “one size fits all” approach, but leaves it up to manufacturers as to what kind of a label is best for their products.
The new regulation, which goes into effect August 14, 2009, applies to both imports and domestically manufactured goods, but it does not apply retroactively to products made prior to that date.
INPENS International College is a private higher learning institution fully backed by the Selangor State Government. The campus located at Kuala Selangor is equipped with the modern teaching-learning facilities.INPENS focus on technical and industry driven programmes. These programmes provide students with vocational training, based on National Occupational Skill Standards (NOSS) recognized by Ministry of Human Resources, and quality controlled by Department of Skill Development (DSD). Students who enroll themselves in these courses will gain quality education on technical knowledge, and skill required to face the challenges of the industry both at local and international level. Students who successfully complete their course will be awarded with Malaysia Skilled Certificate (SKM – Sijil Kemahiran Malaysia) both from Ministry of Human Resources and INPENS.
At present, the Associated Chinese Chambers of Commerce (ACCCIM) is collaborating with INPENS to promote technical and vocational courses for on the job technicians and school leavers.
Available Courses : Dressmaking, Industrial Electronic Mechanic, Motor Vehicle Mechanic, refrigeration & air-conditioning mechanic, Mechanical Engineering Draughtsman, Computer System Technician, Electrical Technician, Hairdresser, Beautician
Duration : Each Level 6 months
Intake : January, July, November
Fee : RM6,000 inclusive of accommodation, food and pocket money
(Lower income families earning below RM1,500 are eligible to apply for full scholarship from INPENS)
Entry Requirement
· SPM/SPVM.
· Malaysian Citizen.
· 17 years old and above.
Please visit www.inpens.edu.my for details. May contact MKMA, ACCCIM or INPENS for further enquiries and applications.
Companies are encouraged to disseminate the information to your staffs and particularly encourage those lower income employees to grab the opportunity and send their children for further education at INPENS.
India and the Association of Southeast Asian Nations have signed a free trade agreement after more than six years of negotiations in Bangkok o n 13 August 2009.According to the agreement, which will be implemented from January 1, 2010, duties will be eliminated on about 3,200 products by December 2013. For the rest 800 products, duty will be zero or near zero by December 2016. These include electronics, chemicals, machinery and textiles. But the deal does not embrace software and information technology.
Tariffs on sensitive goods will be reduced to 5% in 2016, while the agreement excludes nearly 489 very sensitive products from tariff cuts.
Trade between India and ASEAN amounts to $40 billion each year. India has got the market of 1.1 billion in population and ASEAN of 550 million. The size of the two combined will be much bigger than China, Japan and South Korea put together.
The signing in Bangkok marks ASEAN’s fifth such agreement after the ASEAN-Japan FTA, the ASEAN-China FTA, the ASEAN-Korea FTA and the ASEAN-Australia and New Zealand FTA.
ASEAN comprises of Thailand, Singapore, the Philippines, Indonesia, Malaysia, Burma, Laos, Brunei, Vietnam and Cambodia.
To date, there are 662 licensed companies in operation with investments of RM8.3 billion producing a wide range of textiles and textile products and activities from fibres, yarn and fabrics to made-up garments including dyeing, printing and finishing of yarn and fabrics. In addition, it is estimated that about 1,000 small textile companies which are exempted from manufacturing licence are in operation.The major producers of the textiles and textile products are Recron (Malaysia) Sdn. Bhd. (fully integrated textiles), Berjaya Soutex Sdn. Bhd. (yarns), Ramatex Textiles Industrial Sdn. Bhd. (knitted fabrics), Penfabric Sdn. Berhad (woven fabrics) and Perusahaan Chan Choo Sing Sdn. Bhd. (made-up garments).
Exports of textiles and textile products for the period January –November 2008 totalled RM9.6 billion while imports amounted to RM5.0 billion thus making Malaysia a net exporter of textiles and textile products.
The main product exported was apparels. Malaysian apparel manufacturers continue to maintain an excellent reputation for quality and capability in the production of up-market brands such as Nike, Adidas, DKNY, Ann Taylor, Armani, Talbots and Tommy Hilfiger. The main products imported were yarn and woven fabrics which are used to produce apparels.
Projects Approved in 2008
In 2008, a total of 18 projects were approved in the textiles and textile products industry with investments of RM408.3 million. Domestic investments amounted to RM105.4 million while foreign investments totalled RM302.9 million. Of the projects approved, eight were new projects (RM171.0 million) and ten were expansion/diversification projects (RM237.3 million).
Approved investments were in the production of primary textiles with nine projects (RM351.1 million); made-up garments with three projects (RM24.4 million) and made-up textiles and textile products with six projects (RM32.8million). The projects approved are expected to generate a total of 3,090 employment opportunities.
In the primary textiles sub-sector, of the nine projects approved, four were new projects (RM117.2 mi l l ion) and five were expansion/diversification projects (RM233.9 million). Domestic investments amounted to RM87.6 million (25%) while foreign investments totalled RM263.5 million (75%).
The major projects approved included:
§ An expansion project by a wholly foreign-owned company with an investment of RM232 million for the manufacture of yarn, fabrics, and to undertake activities of bleaching, dyeing, printing and finishing; and
§ A new Malaysian-owned project with an investment of RM57 million. The company proposed to manufacture polyester yarn and webbing mainly to cater for the export market.
In the made-up garments sub-sector, three projects were approved with investments of RM24.4 million in 2008. Of these, one was a new project (RM22 million) and the other two were expansion/diversification projects (RM2.4 million). Domestic investments amounted to RM15.6 million (64%), while foreign investments totaled RM8.8 million (36%).
A new Malaysian-Japanese joint-venture project with an investment of RM22.0 million to manufacture undergarments was the major project approved in this sub-sector. The entire production of the proposed project will be exported to Denmark, Canada and United Kingdom.
In the made-up textiles and textile products, six projects were approved with investments of RM32.8 million in 2008. Of these, three were new projects (RM31.8 million) and the other three were expansion/diversification projects (RM1.0 million). Domestic investments amounted to RM2 million (6%), while foreign investments totalled RM30.8 million (94%). Major projects approved included a wholly foreign-owned company with an investment of RM20 million. The company’s proposed products are elbow guard, ankle and knee guard, gloves and waist belts.
Outlook
The Malaysian textiles industry is facing stiff competition from low cost producing countries. Efforts will be intensified to promote investment in the targeted growth areas which include industrial and home textiles, functional fabrics and high-end garments. Initiatives will also be taken to encourage Malaysian textile producers to strive for cost competitiveness, product differentiation and prompt response to the market requirements.
China raised the tax rebate for textile and garment by 1 percent to 16 percent from 1st April 2008.China has raised the export tax rebate rate for textiles four times since last August. The previous increase in February took the rate from 14 percent to 15 percent.
“It was an extraordinary measure taken under extraordinary conditions,” said Zhao Yumin, a researcher with the Ministry of Commerce.
Economist said more refunds meant enterprises could retain more cash in hand and they could use that money to restructure their business and improve production technology.
Experts said nearly all Chinese exports had a 17 percent export rebate during the Asian financial crisis. Compared to that, China still has room for further rebate increases.
The Chinese textile industry has indeed hit a bad patch with several factors working against its competitive edge. But ever since the economic meltdown cast its influence over the apparel demand, the Chinese industry has realigned and reposition itself. The following are eight re-positioning strategies currently applied by Chinese apparel companies.
1. Relocating Production
One way to curb their rising costs is to relocate their industries at places, where the costs of land and labour are lower. For this they have moved in to the interiors.
For example, early in 2008 Hong Kong sweater maker Milo’s Knitwear opened a factory in Jiangxi province, some 650 km from Hong Kong, where operational costs are about 20% lower than in nearby Dongguan. Another famous setup in Dongguan, Dongyue Garment Factory, has relocated one of its workshops to Heyuan City in the north east of Guangdong province and another one to Hubei province. Other companies are relocating production to cheaper Asian countries like Vietnam, Cambodia and Indonesia, and even to commercial hub Dubai, where Chinese workers are reportedly flown.
2. Shifting Focus on Domestic Market
Chinese manufacturers now shifted to the domestic market, which is by no means small. According to the China National Textile and Apparel Council, China’s domestic clothing demand in 2007 rose by 32%, 14.5 percentage points higher than the general growth in consumables.
Western retailers are betting on soaring clothing consumption and growing quality and brand awareness in China. Early October 2008, Marks & Spencer opened a 3, 800 square metre flagship store in Shanghai. Brands such as Zara, H&M, Muji, C&A and American Apparel also have a presence in China, while luxury brands like Gucci and Prada cater to the wealthy.
3. Shift in Export Destinations
So far, the US and EU markets have been the most important export destinations, but these markets have been a bit too crowded with many countries indulging in cut-throat competition. Chinese exporters now have shifted their focus on export destinations to neighboring Asian countries and even to South American markets.
4. Shift from ‘Make’ to ‘Create’
Many firms in Southern China’s apparel producing centres are planning to shift their production model from ‘make’ to ‘create’. The model for Chinese manufacturers who dream of their own brand is ‘Aimer’, China’s top high-end lingerie company in terms of employment (3, 000 staff), sales (US$90m in 2007) and consumer awareness.
5. Shift from Quantitative to Qualitative Production
The Chinese have now realized that there is more money into production and export of quality products rather than quantity. This is the strategy of Hong Kong based TAL Apparel, one of the world’s largest contract clothing producers whose customers include JC Penney, Calvin Klein, Debenhams, Giordano, and Liz Claiborne. Last year TAL started up a new US$70m factory in Dongguan, and it plans to double the size of the factory in 2009.
6. Guarantee-backed Product Quality
Better quality of products, supported by ecological parameters find ready acceptability anywhere in the world, particularly in the more lucrative markets of the US and the EU and in any case, get far better prices than the mass produced apparels.
7. Joint Initiatives Among Chinese Companies
As a recent development, the Chinese companies have been driven to consider joint initiatives in improving their processing. Smaller companies have now chosen to collectively own a common processing unit to process their products at world class standards. Last year, eight textile dyeing and printing plants in Dongguan invested around US$4.5m in a water processing plant.
8. Avoiding Price Competition
There has been an intense cut throat competition among the Chinese manufacturers themselves who have been undercutting each other. Unless they themselves start avoiding under-quoting their prices to win over the buyers, each of them would be net loser.
In Haining (l00 km from Shanghai), a city that claims to represent 25% of China’s warp knitting industry, a price index system has been established to allow companies to adjust the pricing of their products to avoid “vicious price competition”.
In 2008, Malaysian Cotton fabric full-year production posted an impressive gain, rising to the highest level since 1995. Output in 2008 jumped 25.9% from the prior year to 200.8 million meters, reversing three years of mostly flat production.However, if garment production extends its losses much more into 2009, fabric manufacturers will have little choice but to drastically pare back on production in coming months.
Besides, responding to fewer orders from downstream apparel manufacturers and tighter credit conditions from lenders, cotton fabric production plummeted a record -42.0% in December to 14.0 million meters, the worst showing in thirteen months. December also marks the first decrease since October 2007 and follows a string of four straight months of decelerating growth in cotton cloth production.
Malaysian apparel manufacturing saw only a modest rebound in the final month of the year, but steep declines earlier in 2008. Annual volume dropped at a double-digit pace as foreign orders evaporated.Production in December rose 4.3% from a year earlier to 6.8 million garments, only the third increase in the last sixteen months. This final month of 2008 capped off a year that saw ten monthly declines, including eight double-digit losses from a year earlier, as export orders to several key foreign markets sagged under the weight of the global slowdown in consumer spending.
In spite of December’s increase, full-year volume sank -13.1% from a year earlier, extending and accelerating the decline in 2007. Garment output in 2008 shrank to 73.2 million units, the lowest in three years. Annual volume remains relatively little changed from two decades ago.
However, shipments to U.S. shores crept modestly higher in 2008 to 238.8 million square meter equivalents, just missing its 2006 record volume. This suggests Malaysia continues to grow more dependent on the U.S. apparel market. Given that U.S. clothing imports may face another difficult year in 2009, this could bode poorly for the garment manufacturers in 2009.
The Chinese Government is trying to promote the use of the yuan among trade partners. In the past four months, China has signed 650 billion yuan (US95 billion) worth of swap agreements with Argentina, Indonesia, South Korea, Malaysia, Belarus and Hong Kong. The agreements allow them to use their yuan reserves to directly trade with the Chinese mainland within a set limit in volume.
The swap deals would help encourage the use of the yuan as the currency of choice for international trade. In the longer term, if countries around the region and beyond start pricing their trade in yuan, this will also lead to increased internationalization and status for China’s currency.
The move is aimed at reducing the risk from exchange rate fluctuations and giving impetus to declining overseas trade, according to a statement posted on the government website.
The experimental use of the yuan in trade settlement also reflects policymakers’ rising concern over the shaky prospects of the US currency, of which China has large reserves from previous trade growth, and their willingness to gradually expand the yuan’s use globally.
Analysts also said the that US Federal Reserve’s decision to buy long-term Treasuries, which means printing new money, may also lead to a depreciation of the US dollar. That is also one reason for China to reduce the use of the dollar in trade so that the value of its US1.95 trillion foreign exchange reserves does not depreciate.
Chinese exporters are welcoming the Renminbi settlement program, which can help reduce their exposure to currency exchange risks.
The textile industry is one of China’s major export industries. But it faces difficulties caused by the continuous appreciation of the yuan. The Renminbi settlement program could effectively help them avoid currency exchange risks. And they are not the only beneficiaries. For those companies with overseas operations, they will be able to use Renminbi without changing into other currencies.
Sun Huaibin, spokesman of China National Textile & Apparel Council, says, “the new policy will definitely help us hedge foreign exchange risks. For example, our exports suffered considerable losses due to the depreciation of US dollar during the first half of last year. And then we suffered from the depreciation of euro in the second half.”
Japan has now decided to shift its apparel imports, and sourcing from China to other Asian countries. This brings profound connotations to the apparel exporters of Asian countries.
Recently the Government of Japan announced that Japan wants clothing and textile imports from China to drop to around 50% from their current 77% as sourcing from China has become costlier.
Apparel Market of Japan
Japan’s apparel market is regarded as the second largest in the world. Young women’s casual fashion market constitutes approximately 60% of the overall market, and is estimated to be around $28 billion. Japan is open to apparel imports. Many leading apparel manufacturers of Japan have shifted their production sources off-shore, which has increased more than 50% over the past eight years.
‘Street casuals’ such as jeans and t-shirts, and ‘office casuals’ such as shirts, pants, skirts, and sports wears that can be worn at the office have a potential market in Japan. Apart from this, pullovers and jackets also have a good market. Women of Japan prefer to wear garments that are fashionable and trendy.
Japan’s Policy Favors Asian Countries
Japan imports practically all the clothes it wears and 93% of those clothes imports come from China. Just 7% of its clothing imports come from other countries.
Industry analysts predict that the recent declaration of Japan might transform the industrial scenario for many apparel industries and increase their profitability. Possibilities exist that the total apparel exports might double for some industries in Bangladesh and South East Asia. Factories in countries like Thailand, Indonesia, Malaysia and Cambodia might be able to take some business away.
Companies in Japan generally start with a small order, and once they develop a mutual understanding with the manufacturers, place bigger orders. With proper exploration of the market, business development support, and establishing contacts with top Japanese buyers, Asian countries can skim the cream in Japanese apparel market.
Meeting Japanese Standard
Just as important for Asian factories is the timescale many need to bring their operations up to the standard needed by Japanese buyers. Cambodians have found the Japanese want twice as many supervisory staff on a production line as European or American buyers. That adds to cost – and improving operations takes time.
But, for factories that survive this year, coming up to Japanese standards will be a real profit improver in the years to come. Ultimately, there could well be factories in Thailand, Cambodia, Indonesia, Malaysia or Bangladesh that might be able to afford to turn some American or European business away.
On 23 January 2009, the EU’s Official Journal published Directive 2008/121/EC, a “recast” version of current Directive 96/74/EC on textile names which enters into force on 12 February 2009 .
Textile manufacturers who wish to ensure that their products can move around the EU’s internal market without hindrance should certainly acquaint themselves with the provisions of the recast Directive. The text lists names of textile fibres and sets out rules for the particulars to appear on labels and other markings which accompany textile products at the various stages of their production, processing and distribution.
Directive 96/74/EC created a framework of rules governing the labelling or marking of products as regards their textile fibre content. Following its entry into force over 10 years ago, Directive 96/74/EC was subject to amendment on several occasions.
Directive 2008/121/EC aims to ensure that clear, harmonised information continues to be provided regarding the names, composition and labelling of textile products EU-wide.
The recast Directive contains 20 Articles, setting out the conditions and rules for the labelling of textiles.
The recast Directive establishes that no textile product may be described as “100%”, “pure” or “all” (or any similar term) unless it is exclusively composed of the same fibre (Article 4(1)). A textile product may contain up to 2% by weight of other fibres, provided this quantity is justified on technical grounds and is not added as a matter of routine. This tolerance can be increased to 5% in the case of textile products which have undergone a carding process (Article 4(2)).
According to Article 6(1) of the recast Directive, a textile product composed of two or more fibres, one of which accounts for at least 85% of the total weight, must be designated by one of the following:
In the case of a textile product composed of two or more fibres, none of which accounts for as much as 85% of the total weight, such a product must be designated by the name and percentage by weight of at least the two main fibres, followed by the names of the other constituent fibres in descending order of weight, with or without an indication of their percentage by weight (Article 6(2)).
Importantly, the recast Directive sets out additional provisions regarding the percentage compositions that will apply to textile products intended for the end-consumer. For example, a quantity of extraneous fibres of up to 2% of the total weight of the textile product will be tolerated provided that this is justified on technical grounds (Article 6(5)(a)). As regards any product the composition of which cannot easily be stated at the time of manufacture, the Directive provides that the term “mixed fibres” or the term “unspecified textile composition” may be used (Article 6(4)).
On a more practical level, the recast Directive also provides guidance for textile manufacturers regarding the appearance of the labelling to be used. For example, manufacturers will be required to ensure that the names, descriptions and particulars of the textile fibre content are clearly indicated in the commercial documents and that this is done in clear, legible and uniform print when textile products are offered for sale to the consumer.
Further, the recast Directive confirms that, when textile products are offered for sale to consumers, Member States may require that their national language(s) are used by manufacturers for the labelling and marking of said products.
Manufacturers active in the textile industry should also take note of the situations described in the recast Directive when the rules on textile labelling do not apply. These may be summarised as follows:
Access full text of the provision at
http://eurlex.europa.eu/LexUriServ/LexUriServ.do?uri=OJ:L:2009:019:0029:0048:EN:PDF.
US limits on the number of cotton trousers, golf shirts, babies’ socks and more than 30 other textile products that China can export to the US expired on 1 January 2009.
The US industry is worried that what happened in 2005, when similar safe guards were lifted temporarily, will happen again in 2009.
China flooded the U.S. market in 2005, with a more than 1,500 percent increase in cotton trousers alone. U.S. textile companies lost about 55,000 jobs that year, more than 8 percent of the industry’s work force.
Nationally, there was a 33 percent decrease in textile and apparel jobs from 2002 to 2008, with 475,000 jobs left in the industry.
U.S. manufacturers say they’ve learned to compete against China’s lower wages. What they can’t compete with are government subsidies that enable China to sell some finished products for less than the fiber alone costs in the United States.
In an effort to mitigate the possibility of the Chinese dumping textiles, several members of Congress have called for the International Trade Commission to monitor Chinese textiles more closely now that the quotas are expiring.
U.S. Trade Representative Susan Schwab backed up industry concerns by initiated a case with the WTO to get China to stop its allegedly unfair trade practices.
China Offers Hugh Business Opportunities
Meanwhile, China’s Commerce Ministry urged China’s textile enterprises should self-discipline, raise the quality and added value of their products, and cooperate with their partners in other countries to cope with the risk of protectionism on the world market.
The foreign trade official also stressed that the Chinese market has provided huge business opportunities for foreign exporters.
China has also lowered its import tariffs. In 2008, the average of China’s import tariffs fell to 9.8 percent.
The development of China’s domestic textile industry has boosted imports of cotton, wool, raw materials for synthetic fiber and textile yarn. According to statistics, in 2008, China imported 3.49 billion USD worth of cotton, 1.7 billion USD of wool, 750 million USD of synthetic fiber for textiles and 1.57 billion USD of synthetic fiber yarn and thread.
Growing domestic demand in China has created a large market for garment imports. In 2007, China imported 1.97 billion USD in clothing products, up 14.7 percent year-on-year. Between January and November of 2008, the nation imported 2.1 billion USD in clothing, up 16.6 percent from the same period of the previous year.
“We want to stay the accessible, affordable, mid-market international brand that we are perceived as, so we will have to absorb cost increases. We are keenly looking at shifting the product mix in favour of locally sourced materials,” said Nandini Sethuraman, marketing director, Marks & Spencer Reliance India.
The UK-based high street retailer has 14 stores in the country and imports around two-thirds of its apparel range, mainly from the UK, China and Turkey. As it rolls out its expansion, Marks & Spencer plans to ramp up the number of contract manufacturers in the country from about 50 currently.
The change in the duty structure, while not prompted by any malpractices by importers, will help protect domestic suppliers and apparel retailers.
“Although we source a majority of our products locally, it will limit us from bringing newer products into the country. We will have to either drop orders or take a hit on our margins,” said Andreas Gellner, MD of Adidas India.
ChinaReflecting the global economic slowdown, Chinese textile and clothing exports were down by 11% in the first six months of 2009 after growing by 8.2% in 2008 and 18.9% in 2007.
In the US market, in contrast to the general trend, sales of Chinese textiles and clothing in the first half of 2009 advanced by 3.9%. However, growth should have been faster, after the removal of safeguard quotas restricting US imports of several products from China at the end of the previous year.
In the EU, imports from China grew by 12.7% in 2008 after the EU removed quotas at the end of 2007.
In China’s domestic market, textile imports fell in 2008 although production by the Chinese industry grew moderately, and continued to grow in the first half of 2009.
Hong Kong
In Hong Kong, domestic exports of textiles and clothing fell sharply in 2008 while the share of re-exports in total exports reached almost 90%. In the first half of 2009, sales of Hong Kong textiles and clothing in the US market plummeted by 76% as buyers switched to China following the elimination of quota restrictions.
Japan
In Japan, 2008 was a poor year for manufacturers and exporters. Exports to five of the country’s six largest markets fell-as did exports of nine of its ten biggest selling products. Furthermore, domestic wholesale sales of textile products fell for the 11th consecutive year. Domestic production, meanwhile, fell by 8.9% after declining by 5.4% in 2007 and 4.2% in 2006. Imports also declined.
Korea
South Korean textile and clothing exports fell by a modest 1.0% in 2008, due to a fall in clothing sales. Textile exports rose by a minimal 0.3% as weaker demand in the EU and the USA was offset by large increases in sales to Indonesia, Saudi Arabia and the United Arab Emirates. Despite the drop in clothing exports, however, production continued to rise in 2008, as a result of vigorous domestic demand.
Taiwan
In Taiwan, export demand fell in 2008, having remained steady during 2005-07. The fall was due, in part, to the global economic slowdown-which led to a reduction in orders from China and other major Asian markets. Textile and clothing production, meanwhile, fell at a much more alarming rate. Textile output was down by 11.5% and clothing output by 19.2%. To combat falling sales, Taiwanese manufacturers have concentrated increasingly on the production of specialised textiles with higher added value.
The word “nominication” – a combination of “communication” and the Japanese word for drinking (tea rather than alcohol): “Nomimasu”. Nominacation is the art of social business networking to develop trust before deals are discussed in detail.
Companies are warned about some potential hazards. These included ignoring local etiquette, trying to bypass local staff, and skimping on presentation or after sales service.
Firms should do proper research into a market that is unlike any other in the world. Whatever you want to supply in Japan, there are always a couple of local producers. Japan is highly sophisticated so you have to be sure that you know what else you can add to the product to make it fly. Many companies still under-estimate this.
Another catchword in Japan is “patience”, which translates into a series of personal face-to-face meetings with clients.
FTA benefits
The Japanese public loves a novelty, but they also need to feel personally connected to the product they are buying.
Once Japanese customers find a brand they like, they are very loyal. But that loyalty must be earned through sound research, promotion and marketing.
The Malaysian-Japanese free trade agreement (FTA) signed on December 2005 and came into force on 1 January 2006, brings a further boost through tariff reductions and more friendly regulations. The treaty has greater symbolic than short-term financial benefits as many tariffs were low in any case.
Text Box: 16
Besides, Japanese consumers, ravaged by years of economic hardship, are starting to follow new trends. There is a tendency to eat out cheaper and spend less on clothes. Consumers are turning their yen over twice before spending. Producers will have to be smarter at finding ways to sell their unique, add-on value brands.
And with demand for premium wool suits drying up in foreign markets, Gokaldas is producing more polyester viscose suits at nearly half the price of woollen suits.
The demand trend from European and US markets have changed from premium to value and they now want cheap stuff that also look good. So, manufacturers have to find various ways of meeting this demand.
This using of cheaper material, lower thread counts, or a more cost-effective design, has allowed several textile exporters to fill up their order books ahead of the key holiday season in the West.
But it’s still a challenge to make a shirt that cost $69 earlier for $39 and make it look and feel the same.
To reduce input costs, Orient Craft is switching to fabrics that costs Rs80 ($1.71USD) a metre, down by Rs20 ($0.43), and opting for cheaper machine embroidery of Rs35 ($0.75) a metre from Rs50 ($1.07) earlier.
Inbuilt input efficiencies is critical now and they are trying new things like metallic-finish fabric or African prints for clients who want value-added products.
Exporters are also removing non-profit clients that demand high-value products in small volumes.
Mumbai-based Morarjee Textiles Ltd says the way ahead is through value engineering of products, price reduction and product innovation. Many Indian exporters are now trying to include value-added features at a lower cost to push sales.
Morarjee, one of the largest suppliers of material for the Arab headgear guthra—a headscarf worn over a skull cap—has modified the design to make it cheaper.
The company, which also supplies to retailers such as Robert Talbott and Hugo Boss AG, removed a design accessory in the guthra and it has reduced the price by 10-15%.
Midas Touch Export Ltd, has introduced a woven component as value-addition to t-shirts, which are typically made in jersey or knitted fabric.
Earlier, Alok would supply more expensive, finer bed linen with a thread count of 500 per square inch, which has now shrunk to 200-300 making the linen cheaper by 25%.
“Margins are not hit because input costs have also reduced. We can use cheaper quality of yarn to cut cost,” said Alok’s chief financial officer Sunil Khandelwal.
The policy was intended to make New Zealand’s economy more open and efficient, but it was criticised by some because few other countries unilaterally reduced tariffs.
Textile workers and union welcome the freeze on unilateral tariff reductions by postponing the tariff review for another four years, saying it would help protect jobs.
Given the Thailand, China, Malaysia and ASEAN free trade agreements allow NZ to continue with tariffs on TCF imports until 2016, it is sensible that any unilateral elimination of tariffs by NZ does not occur before this date. This will give companies more years to adjust to zero tariff.
New Zealand has very low tariffs with most imported goods entering duty free. Tariffs of 5 per cent apply to textiles and 10 per cent applies to clothing, footwear and carpets.
Malaysia and New Zealand signed a free trade agreement on 26 October 2009 in Kuala Lumpur after four years of talks.Malaysia and New Zealand successfully concluded the bilateral negotiations on the Malaysia-New Zealand Free Trade Area (MNZFTA) on 30 May 2009. This FTA will complement the ASEAN-Australia-New Zealand FTA (AANZFTA), and will further facilitate and enhance two-way trade, services, investment and economic relations in general.
The Asean-Australia-New Zealand FTA will be implemented on Jan 1, 2010. Malaysia and New Zealand are working to determine the earliest possible date to implement their free trade agreement (MNFTA), preferably by next year.
Under the agreement, Malaysia will progressively eliminate import taxes on 10,293 products from New Zealand. New Zealand will scrap the import levy on 7,238 products imported from Malaysia by 2016. Most of our major textile and apparel items exporting to New Zealand will still be subject to import tariff which will be phasing out on a gradual basis. Please refer to MKMA website www.mkma.org for New Zealand’s tariff schedule.
Malaysia’s total trade with New Zealand in 2008 amounted to US$1.9 billion (RM6.2 billion) comprising exports worth US$1.1 billion (RM3.6 billion) and imports US$0.8 billion (RM2.6 billion). Trade during January to April 2009 amounted to US$288.9 million (RM1,046.5 million), with exports worth US$135.7 million (RM491.6 million) and imports US$153.2 million (RM554.9 million).
In 2008 , New Zealand was Malaysia’s:
Growth in total trade between the two countries increased by 14.7% in 2007 and 46.2% in 2008.
The trade pact with New Zealand is Malaysia’s third FTA, following bilateral agreements with Japan in 2005 and Pakistan in 2007.
Main Objective: To provide assistance to viable small and medium enterprises (SMEs) that are constrained by non-performing loans (NPLs), by facilitating loan restructuring and providing financial assistance.Participating Financial Institutions:
Eligibility Criteria : SMEs in all economic sectors that fulfill the following criteria :
Features:
Development Finance and Enterprise Department
Level 9, Blok C,
Bank Negara Malaysia
Jalan Dato’ Onn, 50490 Kuala Lumpur
Website: www.bnm.gov.my
~ by Mr. Tan Nook ~To operate a business, no matter big or small scale, the priority task is to explore markets and adopt marketing strategies in order to sell your products to the world. Usually huge marketing networks will generate revenue and profits. This is the general theory that all businessmen believe.
In the case of engaging in the manufacturing industry, it will be more complicated. The areas of concern cover the manufacturing processes, human resources, administration, financial management, raw materials, accessories etc. You need to plan, to administer, to monitor, to control and supervise to ensure the efficiency of all processes.
Some companies still have not developed internal financial management system. They are unable to control the manufacturing processes, no detailed data record, no complete analysis, no monthly assessment and no review. They only handover all documents to the audit firm at the end of each year for the purpose of compiling the annual report and tax calculation.
From my point of view, it is necessary to establish a systematic manufacturing process. Hence, to follow closely each step of the process and make proper record of all materials consumed or purchased everyday. It would be best to differentiate each recording files with colors to prevent confusion as well as for easy handling.
The filing system must be categorized. If this process is overlooked, it will not provide up to date materials or data for the boss to monitor and subsequently will affect the co-ordination between departments.
Similarly, the store keeping department should also establish such a monitoring system. All outgoing or incoming raw materials, semi products or products should be properly recorded (refer to Chart 1) stating clearly the accumulated balance stock of each items.
On the other hand, before sending the Delivery Order and goods to clients, the sales personnel must get prior approval from the accounting department. This is to facilitate payment collection and to monitor the clients’ status. In the event of arrears, the accounting department can stop delivery of goods to prevent further losses.
Besides monitoring all the abovementioned data, the accountant must prepare a monthly profit and loss statement to be tabled before the monthly directors meeting. The report includes detail analysis on the stocks balance, outstanding bills, bank overdraft status and accruals.
In addition to ensuring the smooth cash flow of a company, a responsible accountant must have the ability to collect debts on schedule. On the other hand, he has to settle monthly outstanding bills accordingly to upkeep the reputation of the company. If a company neglect the advice of the accountant and over financing or over debt, eventually will lost control of the financial management.
Once a company is in poor financial status, immediate remedy has to be taken to cut down lavish expenses, fix assets, non profit generate materials etc. Reluctant to let go may result in heavily indebted with gloomy outlook.
Below are some of my personal financial management methods for your reference :
The above are my personal views and sharing based on years of experiences. I look forward to receive feedbacks and encourage other members to share your experience and expertise so that we can learn from each other for improvements.
Hasting warned that changes in trade rules to give new preferences to large and growing exporters such as Bangladesh and Cambodia would force the Trion plant and many other US textile mills to close. He told the Committee, “Their livelihoods literally rest in your hands.”
Hastings cited a letter that 45 trade groups from 29 countries sent to the Committee opposing any new benefits for Bangladesh or Cambodia. The trade groups included major exporters from North and South America, Africa, Middle East and 9 least-developed countries, including Haiti.
The trade groups noted that apparel exports from Bangladesh and Cambodia have grown by 63% during the last five years while apparel exports from the preference and free trade countries have fallen by 38%. Exports of the top product categories from the major preference and FTA countries have fallen 40% from 2004-8, while exports of the same products from Bangladesh and Cambodia have increased by 194%. The groups explained that apparel exports from Bangladesh and Cambodia to the U.S. are already enormous, totaling $5.5 billion – six times what Africa ships and twelve times what Haiti ships.
The groups cited a statement by the head of the Bangladesh Garment Manufacturers and Exporters Association (BGMEA) that Bangladesh expected to nearly triple its worldwide exports over the next five years and add 1.4 million apparel jobs, even without trade preferences being granted.
The groups explained that they have been told by many of the largest companies that source goods in Africa and the Western Hemisphere that they will move their sourcing to Bangladesh and Cambodia if this proposal becomes law. Under the proposal, retailers and importers would immediately save one billion dollars in duties.
Hasting also noted that if duties are removed, importers would get at least one billion dollar in duties savings that would have otherwise been paid to the US. Treasury. In addition, Bangladesh pays the lowest wage rates in the world and is repeatedly cited for illegal labor practices.
Argentina has developed a comprehensive non-automatic licensing regime that covers a broad spectrum of imports. Non-automatic licences must be obtained before covered products can be imported into the country and there are reports that licences can take more than two months to be issued.Argentinean authorities recently expanded the scope of the textile and apparel products subject to non-automatic licensing, adding the following items to the list effective from 15 November:
5106.10.00, 5106.20.00, 5112.11.00, 5112.19.10, 5205.31.00, 5205.32.00, 5205.41.00, 5206.24.00, 5206.32.00, 5208.32.00, 5208.33.00, 5208.41.00, 5208.42.00, 5208.43.00, 5208.49.00, 5208.52.00, 5209.41.00, 5209.43.00, 5210.11.00, 5210.19.10, 5210.19.90, 5407.73.00, 5407.83.00, 5509.21.00, 5509.32.00, 5510.11.00, 5510.30.00, 5515.13.00, 6006.34.00, 6006.41.00, 6115.99.00, 6116.91.00, 6116.92.00, 6116.99.00, 6117.10.00 (only scarves and similar articles), 6214.10.00 (only scarves and similar articles), 6214.20.00 (only scarves and similar articles), 6214.30.00 (only scarves and similar articles), 6214.40.00 (only scarves and similar articles), 6214.90.10 (only scarves and similar articles) and 6505.90.00 (only ornamented hats, without a visor).
While the Argentinean government does not appear to have a single list with all subheadings subject to non-automatic licensing, a review of the various resolutions issued by the ministry to date indicates that the following apparel items are currently subject to this requirement:
6101.20.00, 6101.30.00, 6101.90.90, 6102.10.00, 6102.20.00, 6102.30.00, 6103.42.00, 6103.43.00, 6104.41.00 (only without a lining, size 16 or lower), 6104.42.00 (only without a lining, size 16 or lower), 6104.43.00 (only size 16 or lower), 6104.44.00 (only size 16 or lower), 6104.49.00 (only with a lining, size 16 or lower), 6104.52.00 (only size 16 or lower), 6104.53.00 (only size 16 or lower), 6104.62.00 (only size 16 or lower, other than bibs), 6104.63.00 (only size 16 or lower, other than bibs), 6104.69.00 (only long trousers, other than bibs, size 16 or lower), 6105.10.00, 6105.20.00, 6105.90.00, 6106.10.00 (only size 16 or lower), 6106.20.00 (only size 16 or lower), 6106.90.00 (only long sleeve, size 16 or lower), 6107.11.00, 6107.12.00, 6107.91.00, 6108.31.00, 6108.32.00, 6108.92.00, 6109.10.00, 6109.90.00, 6110.11.00, 6110.12.00, 6110.20.00, 6110.30.00, 6110.90.00, 6111.10.00 (only sweaters), 6111.20.00, 6111.30.00, 6111.90.00 (only sweaters), 6112.41.00, 6115.10.11, 6115.10.12, 6115.10.14, 6115.10.21, 6115.10.93, 6115.29.20, 6115.95.00, 6115.96.00, 6115.99.00, 6116.91.00, 6116.92.00, 6116.93.00, 6116.99.00, 6117.10.00 (only scarves and similar articles), 6201.11.00, 6201.12.00, 6201.13.00, 6201.92.00, 6201.93.00, 6201.99.00, 6202.11.00, 6202.12.00, 6202.13.00, 6202.91.00, 6202.92.00, 6202.93.00, 6202.99.00, 6203.11.00, 6203.12.00, 6203.19.00, 6203.22.00, 6203.23.00, 6203.29.10, 6203.29.90, 6203.31.00, 6203.32.00, 6203.33.00, 6203.39.00, 6203.42.00, 6204.42.00, 6204.44.00, 6204.62.00, 6205.20.00, 6205.30.00, 6205.90.90 (only short sleeve, size 16 or lower), 6206.10.00 (only size 16 or lower), 6206.30.00, 6206.40.00, 6206.90.00 (only size 16 or lower), 6207.91.00, 6208.91.00, 6209.20.00 (except garments of heading 6210), 6209.30.00 (only garments of headings 6201 or 6202, trousers, dresses, blouses, shirt-blouses, sunsuits and accessories), 6209.90.90 (except garments of headings 6201, 6202 or 6210, sunsuits and accessories), 6214.10.00, 6214.20, 6214.30., 6214.40.00 and 6214.90.10.
The decision was taken after considering an abrupt rise in the export of yarn over the past few weeks, pushing prices for downstream local industry to all time high. During past six months (June-December 2009), more than 368 million kg yarn was exported.
Experts said high anticipated production coupled with restrictions on export are likely to stabilise the prices for the local industry that has recently been pushing the government for banning export of yarn. But the government kept on resisting such pressures, saying it would hurt growers by depriving them of what they earn from the international market.
The following new provisions will come into effect on April 1, following a three-month transition period:
· Synthetic fibres, yarns, plastic parts, etc, will be tested for polycyclic aromatic hydrocarbon substances (PAH) in all four Oeko-Tex product classes. An overall limit of 10 mg/kg applies to the 16 defined substances, and 1 mg/kg to benzo[a]pyrene.
· The softener diisobutylphtalate (DIBP), which is likely be added to the list of REACH substances of very high concern), will be excluded from use as part of the Oeko-Tex certification process (in addition to phthalates, which are already tested for).
· Based on its explicit mention in the EU Directive 2009/425/EC in connection with products such as printed textiles, gloves, textile floorcoverings, etc, dioctyltin (DOT) will be added to the list of prohibited tin-organic substances. A limit of 1.0 mg/kg will apply to baby articles (product class I), as well as 2.0 mg/kg for articles of the other Oeko-Tex product classes.
· The transition provision for total lead content in metallic materials will be extended.
· For the purpose of supporting and optimising operational quality assurance for the companies that participate in Oeko-Tex on a worldwide basis, the association will provide its licensees with a quality-assurance package, starting in April 2010. It says the audits with take place alongside the company audits, which are already being conducted in some countries. The new audits will include production methods, auxiliaries, input materials and ingredients as well as future developments.
The Oeko-Tex Association says that, in the case of new certifications, company audits will be conducted promptly. Longtime participant companies in Oeko-Tex will be audited within the next four years and no later than 2013. However, they may also arrange earlier company visits by Oeko-Tex member-institute auditors if required.
ATPA has been in effect since 1991 and requires the Andean countries to take part in an anti-narcotics program to eradicate the drug trade in their countries. Bolivia used to be a part of ATPA, but President George W. Bush in 2008 asked that the South American country be removed after it failed to participate in the anti-narcotics program.
The House on Dec. 14 also extended the General System of Preferences, now 32 years old, for another year. GSP gives 132 developing countries the opportunity to export many of their goods to the United States duty free. Both trade programs, set to expire on Dec. 31, were approved.
The American Apparel & Footwear Association praised the House’s swift action. “The House’s action to renew these two vital programs was critically important,” said AAFA President and Chief Executive Kevin M. Burke. “Our industry’s ability to utilize these programs helps keep prices low for hardworking American families on necessities like T-shirts, socks and other clothing items.”
Background
On November 2001, ASEAN and China agreed to launch negotiations for an ASEAN-China Free Trade Area (ACFTA). In the following year, ASEAN and China signed the Framework Agreement on Comprehensive Economic Cooperation between ASEAN and China.
Trade In Goods
The Agreement on Trade in Goods was signed in 2004 and implemented in 1 July 2005 by the ASEAN countries and 20 July 2005 by China.
Under this Agreement, the 6 original ASEAN members and China have to eliminate tariffs on 90% of their products by 2010, while Cambodia, Lao, Myanmar and Vietnam, have until 2015 to do so. The remaining 10% are deemed sensitive by parties and will be reduced at a slower pace. There is no physical list for products under Normal Track, in another words, for products that are not found in Sensitive List and Highly Sensitive List, it will automatically fall under Normal Track.
Normal Track
· Tariff liberalisation on all other products (other than EHP) has been implemented beginning 1 July 2005 and to be conducted in four tranches i.e. 2005, 2007, 2009 and 2010.
· ASEAN-6 and China is required to reduce tariffs to 0-5% on 40% of their products by 2005 and 60% of their products by 2007.
Sensitive Track
Products in the Sensitive Track are divided into Sensitive List (SL) and Highly Sensitive List (HSL).
· Duties for Sensitive List will be reduced to 20% by 2012 and to 0-5% by 2018.
· Duties for Highly Sensitive List will be reduced to 50% by 2015. No further tariff cut commitments.
· Malaysia has 361 products in the Sensitive Track, of which 265 are in the SL and 96 in the HSL.
Rules of Origin (ROO)
Under the ACFTA, products imported shall be eligible for preferential concessions if they conform to the origin requirements under any one of the following:
(a) Products which are wholly obtained or produced (Rule 3)
(b) Products not wholly produced or obtained provided that the said products are eligible under the following:
(i) 40% Regional Value Content (RVC).
§ Not less than 40% of its content originates from any Party; or
§ If the total value of the materials, part or produce originating from outside ACFTA does not exceed 60% of the FOB value of the product provided that the final process of the manufacture is performed within the territory of the Party
The formula for the 40% ACFTA content is calculated as follows:
Value of Non-ACFTA materials + Value of materials of Undetermined origin
——————————————————-FOB Price x 100 % < 60%
Therefore, the ACFTA content: 100% – non-ACFTA material = at least 40%
The Value of non-originating materials shall be:
· The CIF value at the time of importation of the materials; or
· The earliest ascertained price paid for the materials of undetermined origin in the territory of the country where the working or processing takes place.
(ii) Cumulative Rule of Origin : all 10 ASEAN countries and China value-added content (VA) of 40%.
(iii) Product Specific Rule (PSR) refers to products which have undergone sufficient transformation in a country and shall be treated as originating goods of that Party.
In summary, Local/Regional value-added content (VA) (%) =
LOCAL/REGIONAL raw material cost
+ Direct labour cost
+ Direct overhead cost
+ Profit
+ Inland transport cost x 100%
FOB
With the adoption of PSR, ASEAN and Chinese exporters/ manufacturers now have the flexibility of choosing the most convenient rule in meeting the origin criteria of the products i.e., either 40% Regional Value Content (RVC) or PSR, in order to enjoy the ACFTA preferential rate.
In order for Malaysian exporters to enjoy the tariff concessions offered by China under the ACFTA, Certificates of Origin (Form E) must be obtained from MITI.
by Khadmudin Hj. Mohd. RafikThe textile and apparel industry was at one time or specifically until the late 90’s, the largest manufacturing sector in Johor both in terms of numbers of establishments as well as total employment. The area of concentration being Johor Bahru, Batu Pahat and Kluang. However with the introduction of WTO the phasing out of MFA and Quota System in 2005, powerful emergence of China and the string of FTA’s being concluded across the globe brought about a significant decline in the industry forcing numerous industry players to relocate, close or face closure by banks.
An industry which is heavily dependent on labour especially imported in constantly beleaguered by sudden and unprecedented Changes in Policies by the authorities governing imported labour, conditions imposed both by Importing and Sourcing Countries, Brand Holders, Buyers and the United Nations which is causing nightmare to the industry players. Uncertainties are prevailing thereby curtailing the growth of the industry whereby an industry which at one time contributed significantly to the exports of the nation is surely rapidly declining and dwindling.
The Global Economic Crisis did not spare Malaysia and the Textile Industry which brought about further closures and failures in textile related companies. At the time of dire need authorities bled the wounds further by implementing “No Levy Deduction” from imported workers, which only saw more money flowing out of the country and an increase in financial burdens to the companies.
With these conditions of uncertainty comes the reluctance of the industry players to commit and invest further into the industry thus bringing about:-
i. Reluctance of establishing Buying Houses in Malaysia by foreign companies;
ii. Lack of investment in the areas of HRD and R&D;
iii. Lack of innovations and investment in new and latest technologies in the textile fraternity;
iv. Institute of higher learning scrapping textile related courses from their programmes;
v. Banks and financial institutions’ reluctance, limiting or totally denying financial assistance and banking facilities to the industry;
vi. Lack of FDI’s into Malaysia.
Looking around us at our neighbours, there’s a clear indication of growth and success and maybe there will come a time when Malaysia will no longer be on the textile map of the world but instead merely domestic and cottage industry. The authorities should conduct a critical analysis of the current scenario and decide once and for all the fate of the industry.
The trade benefits, worth about 100 million euros ($136.1 million) a year to Sri Lanka, will be withdrawn in six months’ time unless EU concerns are addressed.
Sri Lanka benefits from concession in the EU’s Generalised System of Preferences Plus (GSP+), an incentive scheme tied to the improvement of human rights and good governance.
The country came under pressure last year from Western nations, including those in Europe with large Tamil populations, because of civilian deaths in the final phase of the war against the Tamil Tigers, which ended with the separatists’ defeat.
Suspension of the preferential tariffs could hit Sri Lanka’s booming textile industry hard. The country earned a record $3.47 billion from exports of clothing to EU markets in 2008, the largest source of its foreign currency earnings.
Tariff rates of customs duty be “Free” for the following textile items:
5111.11.50, 5111.19.31, 5111.19.32, 5111.19.39, 5111.19.90, 5111.20.19, 5111.20.29, 5111.20.91, 5111.20.92, 5111.30.12, 5111.30.13, 5111.30.18, 5111.30.19, 5111.30.29, 5111.30.91, 5111.30.92, 5111.90.50, 5111.90.91, 5111.90.92, 5112.11.60, 5112.11.90, 5112.19.19, 5112.19.94, 5112.19.95, 5112.20.30, 5112.20.91, 5112.20.92, 5112.30.29, 5112.30.30, 5112.30.91, 5112.30.94, 5112.90.30, 5112.90.91, 5112.90.92, 5113.00.90, 5203.00.90, 5208.12.90, 5208.13.90, 5208.19.90, 5208.21.99, 5208.22.90, 5208.23.99, 5208.29.99, 5208.31.99, 5208.32.90, 5208.33.99, 5208.39.90, 5208.41.90, 5208.42.99, 5208.43.90, 5208.49.99, 5208.51.90, 5208.52.90, 5208.59.99, 5209.11.90, 5209.12.90, 5209.19.90, 5209.21.90, 5209.22.90, 5209.29.90, 5209.31.90, 5209.32.90, 5209.39.90, 5209.41.90, 5209.42.90, 5209.43.99, 5209.49.90, 5209.51.00, 5209.59.90, 5211.42.90, 5309.11.90, 5309.19.90, 5309.21.90, 5309.29.90, 5310.90.99, 5311.00.90, 5407.52.90, 5407.61.11, 5407.61.93, 5407.61.99, 5407.92.90, 5408.10.90, 5408.21.90, 5408.22.29, 5408.22.99, 5408.23.19, 5408.23.99, 5408.24.19, 5408.24.99, 5408.31.90, 5408.32.90, 5408.33.90, 5408.34.90, 5515.13.99, 5515.22.00, 5516.31.00, 5516.32.00, 5516.33.00, 5516.34.00, 5603.11.30, 5603.11.40, 5603.11.50, 5603.11.99, 5603.12.30, 5603.12.40, 5603.12.50, 5603.12.99, 5603.13.30, 5603.13.40, 5603.13.50, 5603.13.99, 5603.14.30, 5603.14.40, 5603.14.50, 5603.14.99, 5603.91.50, 5603.91.90, 5603.92.60, 5603.92.99, 5603.93.60, 5603.93.90, 5603.94.50, 5603.94.90, 5606.00.90, 5801.10.99, 5801.22.29, 5801.22.99, 5801.23.90, 5801.24.90, 5801.25.10, 5801.25.29, 5801.26.90, 5801.31.90, 5801.32.90, 5801.33.90, 5801.34.90, 5801.35.99, 5801.36.90, 5801.90.99, 5802.11.90, 5802.19.90, 5802.20.90, 5802.30.90, 5803.00.19, 5803.00.22, 5803.00.29, 5803.00.99, 5804.10.30, 5804.10.90, 5804.21.90, 5804.29.90, 5804.30.30, 5804.30.90, 5806.10.19, 5806.10.99, 5806.20.90, 5806.31.40, 5806.31.50, 5806.31.90, 5806.32.99, 5806.39.99, 5806.40.90, 5807.10.19, 5807.10.29, 5807.90.90, 5808.10.90, 5808.90.90, 5809.00.90, 5810.10.90, 5810.91.30, 5810.91.90, 5810.92.90, 5810.99.90
Tariff rates of customs duty for the textile and apparel items set out below be gradually reduced to “Free” by no later than January 1, 2015.
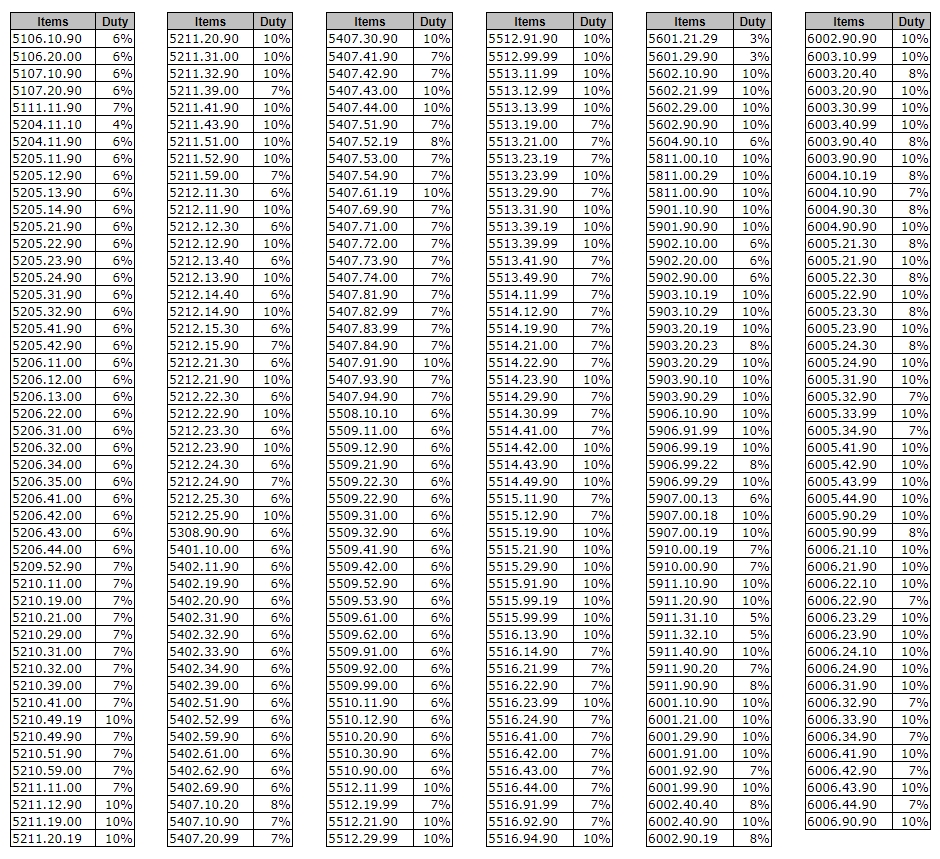
The penalty for non-declaration or making a false declaration is a maximum fine of RM1 million and / or imprisonment of not more than 1 year.
This industry is unquestionably facing more and more challenges as competitors around the world are having cheaper resources and lower production cost with better quality. With so many factories setting up abroad, especially in the developing countries Thailand, Indonesia, Cambodia, Vietnam, China, textile and apparel industry in Malaysia is confronted with the challenges by creating a better link with academia so that the link between industry and academia could be better to attract more young new blood to understand and join the industry.
Today, we observe that a few institutions like UiTM, Tunku Abdul Rahman College and Kolej Selatan are providing the courses for training new blood to cater for the industry. Nevertheless, there are questions to be answered:
· How effective are the training and education provided through the courses offered by the academia?
· What are the real feedback from the industry on the graduates who have completed their studies and currently working in the industry?
· Does the collaboration between industry and academia really help to enhance industry growth?
· Does the industry have a strong leader with obligations and commitments to lead the link between industry and academia for growth in the next 20 years?
We acknowledge that human capital is the most important asset of the industry and the survival of the industry rests on the human capital. The development of the industry not only depends on the existing workforce but also the future enrolment of young blood who need to acquire the skills and entrepreneurial knowledge. Training and education must continuously be provided to train and educate the workforce with skills and particular competencies needed in the industry. We have to look into the current situations of not able to recruit the workforce at different levels;
1. Management staff with entrepreneurial skills
2. Supervisory staff with skills and competencies
3. Operators with knowledge and skills
MATAC has worked with Malaysian Institute of Management (MIM) and has developed a customised Professional Diploma in Textile & Apparel Management specifically for the industry, however; without such strong support from the industry on such collaboration, textile and apparel industry will remain skeptical of the vision for change and it is difficult to see the light in the tunnel for the industry without the full commitment for the collaboration between the academia and industry to work out a long term link, that training and education help to provide the needed workforce at all the levels for the growth and survival of the industry. Presently, most of the people in the industry may agree that we are not in a very comfortable position to maintain our position to have an annual export of RM10 billion. Let us all work hard to improve the current situation for the better future of this industry.
(This article is courteously contributed by Mr. Liaw Fenn Yenn, Head of Tunku Abdul Rahman College [TARC- Johor Branch])
Currently, there are more than 670 licensed companies in operation with investment of RM8.6 billion. In addition, there are more than 1,000 small scale textile companies in operation which are exempted from Manufacturing Licence. The industry employs more than 68,200 persons.Malaysia was a net exporter of textile and textile products in 2009 (January – November) with exports totaling RM8.1 billion while imports amounted to RM4.0 billion. The main products exported were apparels and clothing accessories. Malaysian apparel manufacturers continue to maintain excellent reputation for quality and capability in the production of up-market brands such as Nike, Adidas, DKNY, Ann Taylor, Armani, Talbots and Tommy Hilfiger. The main products imported were yarn and woven fabric.
Project Approved in 2009
In 2009, nine new projects were approved with total investment of RM333.6 million. Foreign investment totaled RM225.2 million (67.5%) while domestic investment amounted to RM108.4 million (32.5%).
Of the approved projects, four were for the production of made-up garments and one each for fibre and yarn; fabrics; textile products; textile accessories; and recycling textiles. The projects approved are expected to generate 1,345 employment opportunities
Investment in Projects Approved in the
Textiles and Textile Products Industry by Sub-sector, 2009
Significant projects approved included:
· A new majority foreign-owned project with investment of RM287.8 million for the manufacture of specialty polyester filament yarn. This is the first project of its kind to produce high content micro filament yarn with technical and functional features such as flame-retardant, breathable and anti-bacteria. The project proposed to export its entire production;
· A new majority foreign-owned project to produce woven fabrics with investment of RM9.5 million and catering mainly for exports to China, Korea and USA; and
· A new majority foreign-owned project with investment of RM3.2 million for the manufacture of made-up garments. The project proposed to utilize domestic latex sheets and fabric backed latex to produce sportswear, swimwear, skiwear or winter outerwear, mainly for the export market.
Future prospects in Malaysia in the textile industry lie in the promotion of high performance textiles, made-up garments and textile products with functional and technical features both in the upstream and downstream sub-sectors. The application of functional and technical textiles are in sectors such as aerospace, automotive, industrial, construction, anti-ballistic protection (police, army), marine, high performance apparels (fire-fighters, racing), medical, sportswear and filtration.
China ranked among the top 20 countries, based on the number of GOTS-certified facilities per country. The other 19 countries spearheading the organic textile movement are India, Turkey, Pakistan, Japan, Korea, Italy, Germany, Bangladesh, the United Kingdom, Hong Kong, Peru, Sri Lanka, Mauritius, USA, Portugal, Taiwan, Indonesia, France and the Netherlands.
The new GOTS system aims to aid manufacturers, suppliers, retailers and consumers in making more environmentally conscious decisions, along with facilitating and fostering the emerging organic market.
More information of GOTS available on http://www.global-standard.org
RISKS FROM CORDS AND DRAWSTRINGS IN CHILDREN’S CLOTHING
Upon the inspections, corrective actions were taken by the respective national authorities. The manufacturers, distributors, importers and retailers for children clothes to ensure that the cords and drawstrings used in the clothes must comply with the European standard number EN 14682:2007. Among the standards outline include:
– Clothes for children up to 7 years (height 1.34 m) should not have cords or drawstrings in the hood and neck area.
– Clothes for 7 and 14 year olds should not have cords longer than 75 mm (7,5 cm) in the hood and neck area or drawstrings with free ends. Cords in the hood and neck ar ea should not be elastic except for shoulder straps and halter necks.
– Clothes for children should not have cords or drawstrings with free ends longer than 140 mm (14 cm) in the chest and waist area.
– Halter neck-style children’s clothes should not have loose ends in the hood and neck area.
– Children’s clothes intended to be tied at the front should not have tied belts or sashes longer than 360mm (36 cm).when measured untied from the point where they are to be tied 6.
Malaysian manufacturers of clothing particularly children clothing must ensure that they comply with the European standard in order to avoid their products being rejected by the relevant authorities.
Malaysian Industrial Development Finance Berhad (MIDF) is an agency established in 1960 under the Ministry of International Trade and Industry Malaysia (MITI).
Two soft loan schemes of MIDF are now re-open for application for companies and enterprises operating in Malaysia.
MIDF provides a range of conventional as well as Islamic financing facilities such as term loans, industrial hire purchases, revolving credit and factoring for companies and enterprises that are well-established with a track record.
Advantage of MIDF Soft Loan Schemes – Low Interest Rates!
The 2 (two) Soft Loan Schemes have been specifically designed to meet the financing requirements of companies and enterprises:–
Financing granted under these Soft Loan Schemes are charged competitive interest rates of 4% per annum for SMEs whilst 5% per annum for Non-SMEs.
Application
All applications shall be submitted to MIDF for approval. For further enquiries and applications, please contact one of the followings :
Email: inquiry-feedback@midf.com.my
MIDF Sales Department office on Level 15, Menara MIDF, 82, Jalan Raja Chulan, 50200 Kuala Lumpur (Tel : 03 -21738888)
MIDF Regional Office nearest to you – Northern Region (Tel : 04-2298434), Southern Region (Tel : 07-2232727), Sabah Office (Tel : 088-211633)
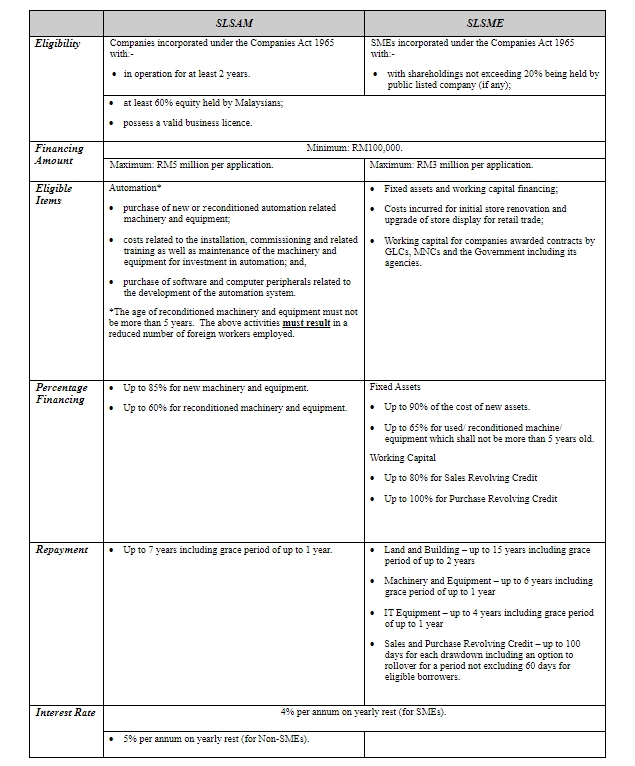
Cotton may climb to the highest price since 1995 as rising demand in emerging markets for everything from shirts to bed sheets forces textile makers to restock inventories that are the tightest in 13 years.
Export sales by the US, the largest shipper, are off to their fastest start since 1993 as apparel demand in China, the biggest consumer, increased 24 percent. Cotton may advance 13 percent to a 15-year high of 94.9 cents a pound before new supplies are harvested in October, according to 17 analysts.
Production Deficit
Production by the world’s cotton farmers will fail to keep up with demand for a fifth straight year, according to the U.S. Department of Agriculture.
Global demand probably will grow 2.7 percent this year to 120.87 million bales as China boosts imports by 14 percent to 12.5 million bales and Pakistan’s surge 53 percent.
U.S. export sales of upland cotton, the most common variety it grows, totaled 5.41 million running bales for the marketing year that began Aug. 1, more than twice as much as a year earlier and the most since 1993. A running bale weighs 500 pounds, or 227 kilograms.
Shrinking Supply
Worldwide stockpiles will drop 4.1 percent to 45.61 million bales, or about 38 percent of demand, the lowest ratio since 1994.
During the recession, everyone got rid of inventories, yarns, woven goods, textiles, clothing etc. There was tremendous purging, and now everyone is trying to rebuild inventories.
Stockpiles are slipping as emerging-market economies expand at more than twice the pace of the U.S. and six times the rate of the euro zone. India will grow 9.4 percent this year and China’s gross domestic product will increase 10.5 percent.
Clothing Demand
Then there’s an increase in global consumption. For the fifth straight year, production of the commodity will not keep up with demand, according to the USDA.
India’s middle class is growing. They have started spending more money on grooming better and on wardrobe. Things are changing and this trend will continue for another 20 years.
Retail sales of garments, footwear, hats and knitwear in China jumped to 38.8 billion yuan ($5.7 billion) in July, bringing the total to 314.1 billion yuan for the first seven months of the year.
The global harvest is expected to jump 14 percent to 116.85 million bales in the year that began Aug. 1, the most in three years and the biggest increase since 2005-2006, the USDA estimates. U.S. output will surge 52 percent to 18.53 million bales, with the bulk of the harvest starting in October.
Crop Damage
Floods and landslides during the past two months have destroyed crops in China, which grows almost a third of the world’s cotton. Output may drop 5 percent to 10 percent.
The U.S. is the third largest producer of cotton in the world, next to China and India. India, the world’s second biggest cotton grower, will begin registration of export contracts from Oct. 1. India will limit exports to 5.5 million bales in the season starting Oct. 1. Exports beyond that level will attract a “prohibitive” duty.
Coming in at fourth is Pakistan, the deadliest floods in decades destroyed 30 percent of its cotton crop and may spur more imports. Rains and floods affected around 200 million cotton bales. Pakistan has been importing cotton from India for the past few years and is one of the main importers of cotton from India.
Another top producer, Russia, has been hit with fires and drought conditions.
Higher cotton costs are squeezing clothing makers, who have passed along some of the expense to consumers.
Cotton prices may remain “historically high” until at least the U.S. harvest, said Cliff White, a senior vice president at Singapore-based Olam International Ltd., the world’s third-biggest cotton trader.
“Supplies of cotton are at all-time lows,” Hanesbrands Chief Executive Officer Richard A. Noll said. “While I can’t predict the price of cotton on any given day, I do think over time, long term, you’re going to see the price of cotton continue to rise.”
Malaysia is on way to formulate its own minimum wage model. The model is expected to be tabled to the Cabinet by October.
This way, the Government believe would encourage more locals to take up menial jobs. More foreign unskilled workers will be displaced.
The consensus, nevertheless, is that a minimum wage policy has to be accompanied by a corresponding improvement in productivity; otherwise, a minimum wage policy will do more harm than good for the economy in the long run.
For instance, without any improvement in productivity, a higher level of pay to workers as required by the minimum wage policy will only translate into higher costs for businesses.
Minimum wages often come with a common side-effect – rising unemployment among the poor, the very group which we intend to help. This is understandable, as the higher cost of employees tend to make employers do one basic thing – fire those they can do without. The imposition of minimum wage will likely make businesses extra cautious, leading to a cutback in the number of workers.
Obviously, minimum wage system for Malaysia has to be adapted according to the country’s environment, culture and work ethics.
For manufacturers, everything is tied to productivity and a reward system better suits the sector rather than the minimum wage scheme. When compare with other countries, will Malaysian companies maintain it’s competitiveness?
Will the minimum wage system improve or dampen the country and the companies’ competitiveness? Let’s study and compare our competitors wage schedule.
Thailand : minimum daily wage: 162 baht or some 480 ringgit ($126) per month
China :
| Provinces | Minimum Salaries
(RMB/Month) |
| Shanghai | 1,120 |
| Shenzhen | 1,100 |
| Guangdong | 1,030 |
| Beijing | 960 |
| Qinghai | 770 |
| Hainan | 630 |
| Henan | 600 |
Cheap labor will not come soooo cheap anymore in China. At least 18 provinces, including big cities like Beijing and Shenzhen, have increased the minimum wage by an average of 20 percent. It is expected that all 23 provinces plus the 4 big municipalities will follow suit.
Shanghai now has the highest monthly pay in the country, with a minimum salary at 1,120 RMB.
Guangdong, China’s biggest export base, boosted five local minimum wages in the province by an average 21 percent, with the highest pay increasing to 1,030 RMB.
Beginning July 1, Beijing increased the city’s minimum wage by 20 percent to 960 RMB ($140) a month from 800 RMB. Beijing offers the highest minimum hourly wage of around 11 RMB from 9.6 RMB.
In Henan, the nation’s most populous province with almost 100 million residents, the lowest legal salary is 600 RMB a month compared with 1,100 RMB in Shenzhen, where Foxconn employs the largest portion of its 800,000 workers in China. In Hainan, the minimum wage stood at 630 RMB.
Qinghai, located on the Tibetan plateau will raise the lowest wages by an average 28.8 percent from next month, boosting the monthly income in some areas to 770 RMB (113 dollars).
Bangladesh : US$43
Bangladesh nearly doubled minimum wages in the important garment, but the new benchmark is still well short of what workers’ groups had been demanding.
The minimum wage for garment workers will be raised to 3,000 taka a month, or about $43, from 1,662.50 taka; workers’ groups and unions wanted 5,000 taka. The new wage includes an allowance of 200 taka for medical expenses and 800 for housing.
More than three million Bangladeshis work in the garment industry, which accounts for a vast majority of the country’s exports.
In the last two months, protests by workers demanding higher pay have periodically shut garment factories across Bangladesh. The protests have often turned violent, injuring some workers and police officers.
Cambodian : $61
The Labour Advisory Committee, a body made up of government officials and industry representatives voted to increase the monthly minimum wage by the equivalent of $5 and endorsed a government call to merge the existing $6 cost-of-living supplement into the basic wage, thereby raising the minimum wage from $50 per month to $61. After the $11 increase, due to take effect on October, wages will remain frozen until 2014. All five union representatives voted for the agreement.
However, the outcome does not match the expectations of some of the workers’ leaders who anticipating the same to be raised to $93.
Discontent over pay, working conditions and government repression has been intensifying since the beginning of the year.
In May, 80 employees of the Tack Fat garment factory staged a protest. In June, 3,000 workers held demonstrations at the Ocean Garment Factory. In July, over 2,000 Berry Apparel workers staged a strike, demanding an immediate rise in their wages. On July 27, an estimated 3,000 workers involved in a week-long strike at the Malaysian-owned PCCS Garments in the district on the outskirts of the capital Phnom Penh.
An estimated 330,000 people work in the Cambodian garment sector, with another 250,000 employed indirectly. It is the country’s third-biggest industry behind tourism and agriculture.
One out of five Cambodian women aged between 18 and 24 depends on the garment industry for work. The recession forced the closure of 77 garment factories in Cambodia in the first nine months of 2009 while another 53 factories suspended operations. At least 40,000 Cambodian garment workers have lost their jobs. 90 percent of the industry is owned by foreign capital.
Vietnam : US$63
Textile and garment units across Vietnam will raise the minimum salary for their employees by up to 30 percent. The agreement will be applied on a trial basis and aimed at protecting workers’ rights and reducing strikes. There were 387 strikes in 2006, 541 cases in 2007 and 773 in 2008.
Vietnam Textile and Apparel Trade Union (representative for workers) and the Vietnam Textile and Apparel Association (representative for enterprises) signed a collective labor pact in Hanoi on 17 May 2010.
The agreement comprises 14 conditions and terms on job assurance, minimum salary and overtime pay. Factories have to register to apply the pact.
69 textile and apparel units have registered to implement the agreement. They employ a total of 90,266 employees, or nearly half of the industry workforce of 200,000 people.
Though many textile companies have yet to register to apply the pact, it will push salaries of the sector up
The Chinese government has ordered the closure of 2,087 companies in 18 different industries – including the dyeing and finishing sector – as the country mulls a new environmental tax on manufacturing to crack down on highly polluting industries.
The list includes 201 textile printing and dyeing mills (Full list posted on MKMA Chinese Weekly News issue 33/10), 80 leather tanneries, 762 cement factories, 279 paper mills, 175 steel mills and 192 coking plants which were deemed highly polluting, highly energy-wasting, or did not meet safety requirements.
Meanwhile, three Chinese ministries will soon submit a proposal for an environmental tax on a trial basis. An environmental tax is likely to be levied on emissions of carbon dioxide and discharges of polluted water. The tax would be tested in four largely rural provinces, Hubei, Hunan, Jiangxi and Gansu.
China has already taken steps to crack down on highly polluting industries and many expect it to get progressively tougher in the coming years.
These new moves are part of the Chinese government’s efforts to restructure its slowing industrial output and to meet environmental standards under its current Five Year Plan.
The Malaysia-New Zealand Free Trade Agreement (MNZFTA) came into effect on 1 August 2010. It is Malaysia’s third bilateral FTA after Japan and Pakistan and extends Malaysia’s FTA network to the Oceanic region.
The FTA marks another milestone in Malaysia – New Zealand economic relations and value-adds to the benefits shared from the ASEAN-Australia-New Zealand Free Trade Agreement (AANZFTA) implemented on 1 January 2010.
Under the Agreement, Malaysia and New Zealand will progressively reduce or eliminate tariffs on their respective industrial and agricultural products by 2016.
The Malaysian business community is encouraged to take full advantage of the opportunities offered under this comprehensive FTA. The FTA creates an attractive operating environment for the business community of both countries to further strengthen their bilateral trade and economic linkages on a long term basis.
Last year, Malaysia’s total trade with New Zealand was RM3.5 billion, with exports amounting to RM1.9 billion and imports RM1.6 billion. In the first six months of this year, Malaysia’s trade with New Zealand was RM2.1 billion, with electrical and electronic appliances, chemical, processed food and manufactured metals as major exports. Processed food, paper and pulp and machinery were major imports from New Zealand.
Malaysia will remain committed and are moving aggressively to strengthen the implementation of the two-way Free Trade Agreement (FTA) with several countries of the world. Malaysia is in the process of discussions to sign FTA with Chile, Australia, Turkey, India, Bangladesh and the European Union (EU).
Details of tariff schedules under MNZFTA (focusing on textile and apparel items only) for both countries.
MALAYSIAN TEXTILES AND APPAREL INDUSTRY
The performance of the textiles and apparel industry in Malaysia was affected by global economic crisis. The overall decline in productions, sales and exports were mainly due to the decrease in consumption in major export destinations such the USA, EU and Japan. The industry is expected to recover in 2010 in line with the overall increases in the confidence of retailer to replenish their stock in anticipation of increased consumption due to the economic recovery.
Production
The textiles and apparel industry recorded negative growth in production in 2009. The textiles segment recorded a greater decline (-22.6%), compare with the apparel segment (-18%). The major decline was in the manufacture of knitted and crocheted fabrics and articles which had decreased by 29%.
The factors which had contributed to the overall decrease in production were:
Production Index of the Textiles and Apparel Industry (2005=100)
Sales
Sales of the textiles and apparel industry amounted RM7 billion in 2009, compared with RM7.6 billion in 2008. The reduction in overall sales was mainly due to decrease in orders and cancellations during second half of 2008 to early of 2009.
Sales of Textiles and Apparel Products
Employment
Employment in the textiles and apparel industry declined by 10.7% to 47,390 workers in 2009 from 53,071 workers in 2008 due to declining orders. Skilled workers nevertheless were retained to maintain the quality of products as many of the manufacturers were supplying OEM high-end products.
The cost of labour in Malaysia is much higher than its regional competitors such as Vietnam, Indonesia and China which had resulted in higher price for the country’s products.
Employment in the Textiles and Apparel Industry
Exports
Total exports of textiles and apparel in 2009 were valued at RM8.9 billion, compare with RM10.5 in the previous year. A total of RM5.1 billion or 56.8% of Malaysia’s exports in 2009 were textiles. The top three export items of textiles and apparel were textiles yarns (RM2.5 billion), woven and other textiles apparel (RM1.3 billion) and men’s apparel, not knitted/crocheted (RM643.5 million).
The USA was the largest export market for textiles and apparel in 2009, with exports amounting to RM1.8 billion and accounting for 20% of Malaysia’s total exports for textiles and apparel. The second largest market was Japan (RM720.1 million), followed by Singapore (RM486.4 million), Mexico (RM460.4 million) and China (RM408.4 million).
Quotas imposed on exports of textiles and apparel products from China to the USA was lifted in the beginning of 2009 as one of the conditions for China entry into the World Trade Organization (WTO). The lifting of the quota enabled China to increase its market share, thus affecting Malaysia’s exports to the USA.
Exports of Textiles and Apparel Products
Prepared by MITI
Major Export Countries
Imports
Imports of textiles and apparel decreased by 18.3% to RM4.5 billion in 2009 from RM5.5 billion in 2008. The reduction was due to the decline in consumption, especially for expensive foreign items.
Major sources of imports for textiles and apparel products were China of RM1.6 billion or 35.6% of total imports. Taiwan was next with RM427.8 million followed by Thailand (RM378.3 million), Indonesia (RM314.3 million) and Japan (RM288.2 million).
Imports of Textiles and Apparel Products
Prepared by MITI
Salient Development in the Industry
The 2009 Budget had exempted the employers from paying the human resource development levy for six months effective from 1 February 2009 to 1 July 2009. A total of 329 employers in the textiles and apparel sector enjoyed the exemption amounting to RM2.7 million. The exemption was given due to the declining demand and sales of textiles and apparel products which had affected the competitiveness of the industry. The government further announced a reduction in the 1% levy to 0.5% for the period of two years effective 1 April 2009.